> ## Documentation Index
> Fetch the complete documentation index at: https://docs.suprsend.com/llms.txt
> Use this file to discover all available pages before exploring further.
# Analytics
> Centralize notification performance tracking, monitor delivery across channels, and gain insights to optimize your notification strategy.
Analytics provides visibility into your notification system. Track notification lifecycle signals, understand user engagement patterns, and optimize your workflows based on near real-time data.
Navigate to the [Analytics tab](https://app.suprsend.com/en/production/analytics/) to get started.
**Analytics vs Logs:** Analytics shows trends and summaries (like "email has 45% open rate"). [Logs](/docs/logging) shows individual events (like "this email was delivered at 2:34 PM"). Use Analytics to spot patterns, then use Logs to investigate specific issues.
***
## Available data points
Analytics provides visibility into notification performance across multiple dimensions. You can analyze data by:
* **[Channel performance](#channel-performance)** - Identify underperforming channels by comparing delivery and engagement metrics or look for any dips in delivery, open or click rates over time.
* **[Notification volume](#notification-volume)** - Detect over-messaging patterns by tracking notifications per user across channels and categories.
* **[Unsubscription trends](#unsubscription-trends)** - Reduce churn by understanding which channels and categories drive opt-outs.
* **[Workflow Level Breakdown](#workflow-level-breakdown)** - Optimize notifications by comparing engagement across workflows, templates, channels and vendors.
* **[Errors](#errors)** - Proactively fix issues by surfacing API, workflow, and delivery errors before users notice.
***
### Performance Overview
Performance Overview provides a high-level view of your notifications performance.
#### Channel performance
Compare delivery and engagement across channels to see where users are most responsive. You see overall delivery, open and click rates by channel and their timeseries trend.
You can drilldown graph by template-in addition to the [global filters](#filters) (workflow, tenant, date range).
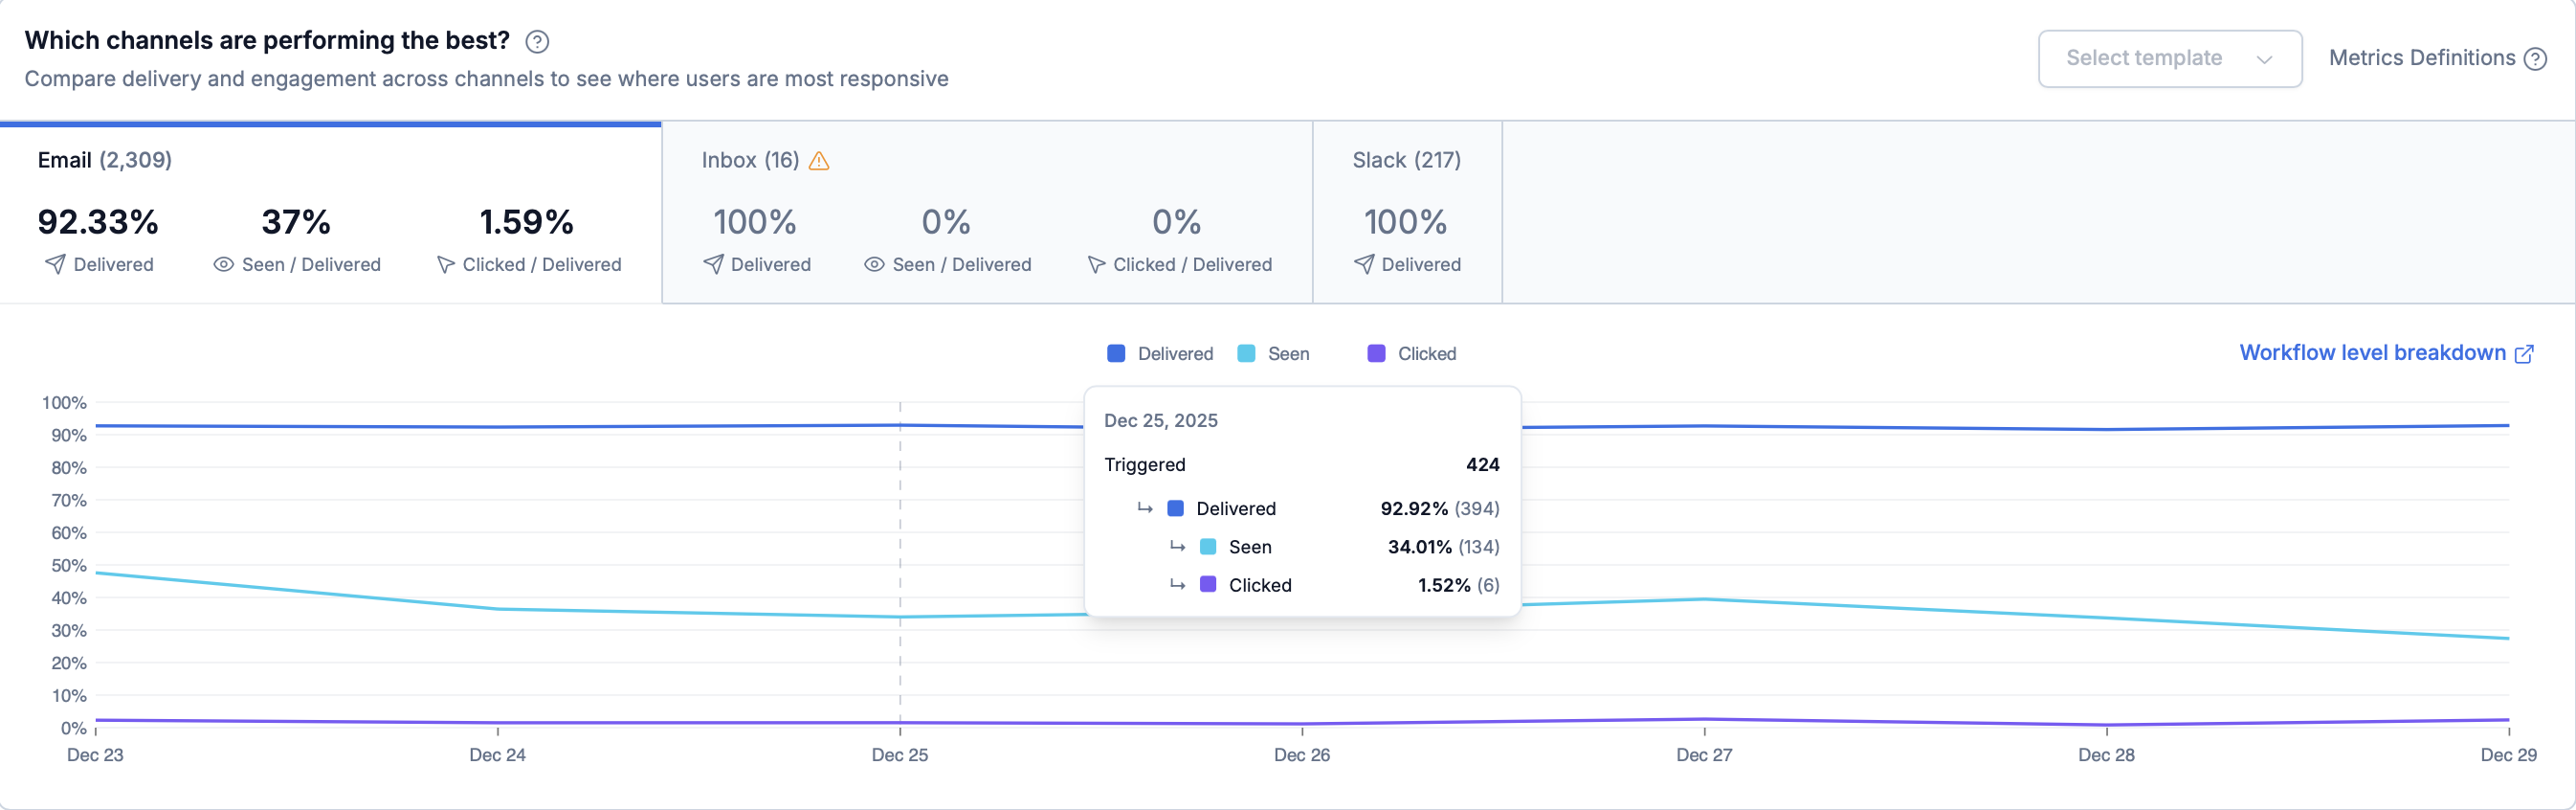 The chart above shows these metrics by channel.
| Metric | What it means |
| -------------------- | -------------------------------------------------------------------------------------------- |
| **Delivered** | Provider or channel reports a delivered (or final) status |
| **Seen** | A view/open signal is received (varies by channel) |
| **Clicked** | User clicked on the notification |
| **Delivery Failed** | Provider or channel reports a delivery failed status |
| **Delivery Blocked** | Delivery blocked by SuprSend when test mode is enabled and the channel is not a test channel |
You might see a warning icon next to a channel when the tracking is not properly configured for the channel. Click on the icon to see the details and fix the tracking issue.
The chart above shows these metrics by channel.
| Metric | What it means |
| -------------------- | -------------------------------------------------------------------------------------------- |
| **Delivered** | Provider or channel reports a delivered (or final) status |
| **Seen** | A view/open signal is received (varies by channel) |
| **Clicked** | User clicked on the notification |
| **Delivery Failed** | Provider or channel reports a delivery failed status |
| **Delivery Blocked** | Delivery blocked by SuprSend when test mode is enabled and the channel is not a test channel |
You might see a warning icon next to a channel when the tracking is not properly configured for the channel. Click on the icon to see the details and fix the tracking issue.
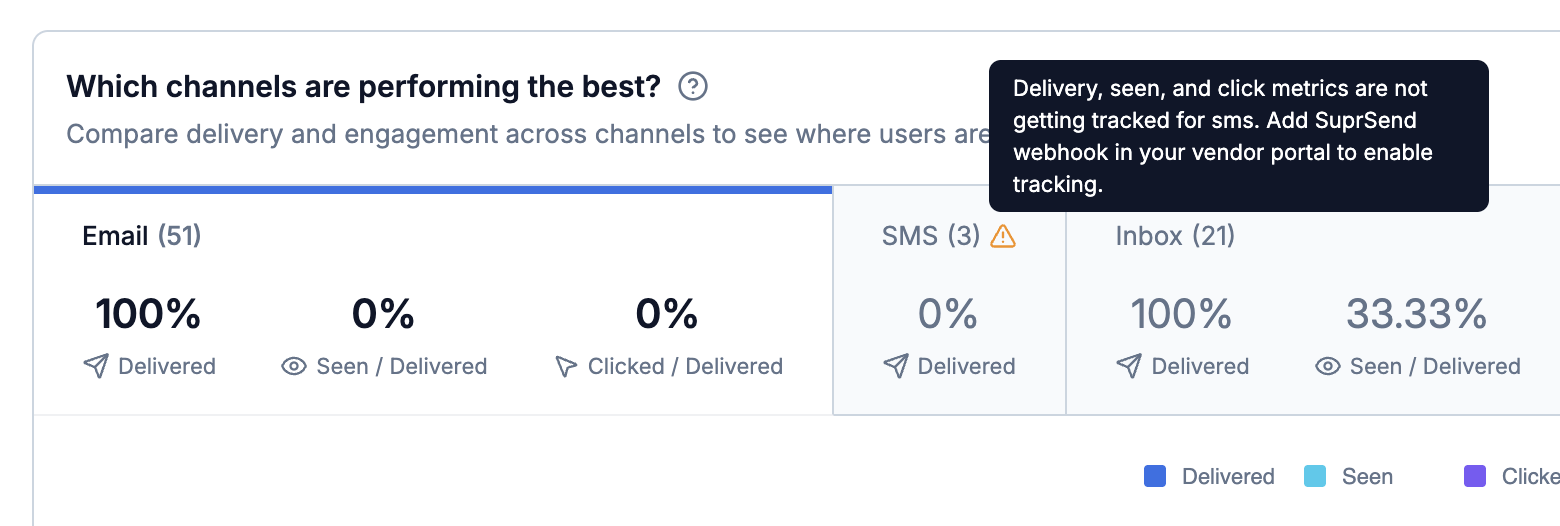 **Metrics tracked across channels:**
Not all channels track all metrics. Here's what's tracked at the channel level:
| Channel | Delivered | Seen | Clicked |
| ---------------------------------------------- | --------- | ---- | ------- |
| Email, Android Push, iOS Push, Web Push, Inbox | ✅ | ✅ | ✅ |
| WhatsApp | ✅ | ✅ | ❌ |
| SMS, Slack, MS Teams | ✅ | ❌ | ❌ |
Configure `https://hub.suprsend.com/webhook/*` in your vendor dashboard to track delivery, seen, and click events for email, SMS and WhatsApp. See [vendor integration docs](/docs/vendors) for step-by-step instructions.
**Interpreting your metrics:**
Investigate vendor issues or delivery failures in [Errors](#errors).
Review content and send timing. Use [Workflow Level Breakdown](#workflow-level-breakdown) to find which workflows are dragging the metric. If volume is high, use [batching](/docs/batch) or [throttling](/docs/throttle).
For export options, see [Exporting data](#exporting-data).
***
#### Notification volume
Monitor average notifications sent per user per day. **Over-messaging is one of the reasons users unsubscribe.**
**Metrics tracked across channels:**
Not all channels track all metrics. Here's what's tracked at the channel level:
| Channel | Delivered | Seen | Clicked |
| ---------------------------------------------- | --------- | ---- | ------- |
| Email, Android Push, iOS Push, Web Push, Inbox | ✅ | ✅ | ✅ |
| WhatsApp | ✅ | ✅ | ❌ |
| SMS, Slack, MS Teams | ✅ | ❌ | ❌ |
Configure `https://hub.suprsend.com/webhook/*` in your vendor dashboard to track delivery, seen, and click events for email, SMS and WhatsApp. See [vendor integration docs](/docs/vendors) for step-by-step instructions.
**Interpreting your metrics:**
Investigate vendor issues or delivery failures in [Errors](#errors).
Review content and send timing. Use [Workflow Level Breakdown](#workflow-level-breakdown) to find which workflows are dragging the metric. If volume is high, use [batching](/docs/batch) or [throttling](/docs/throttle).
For export options, see [Exporting data](#exporting-data).
***
#### Notification volume
Monitor average notifications sent per user per day. **Over-messaging is one of the reasons users unsubscribe.**
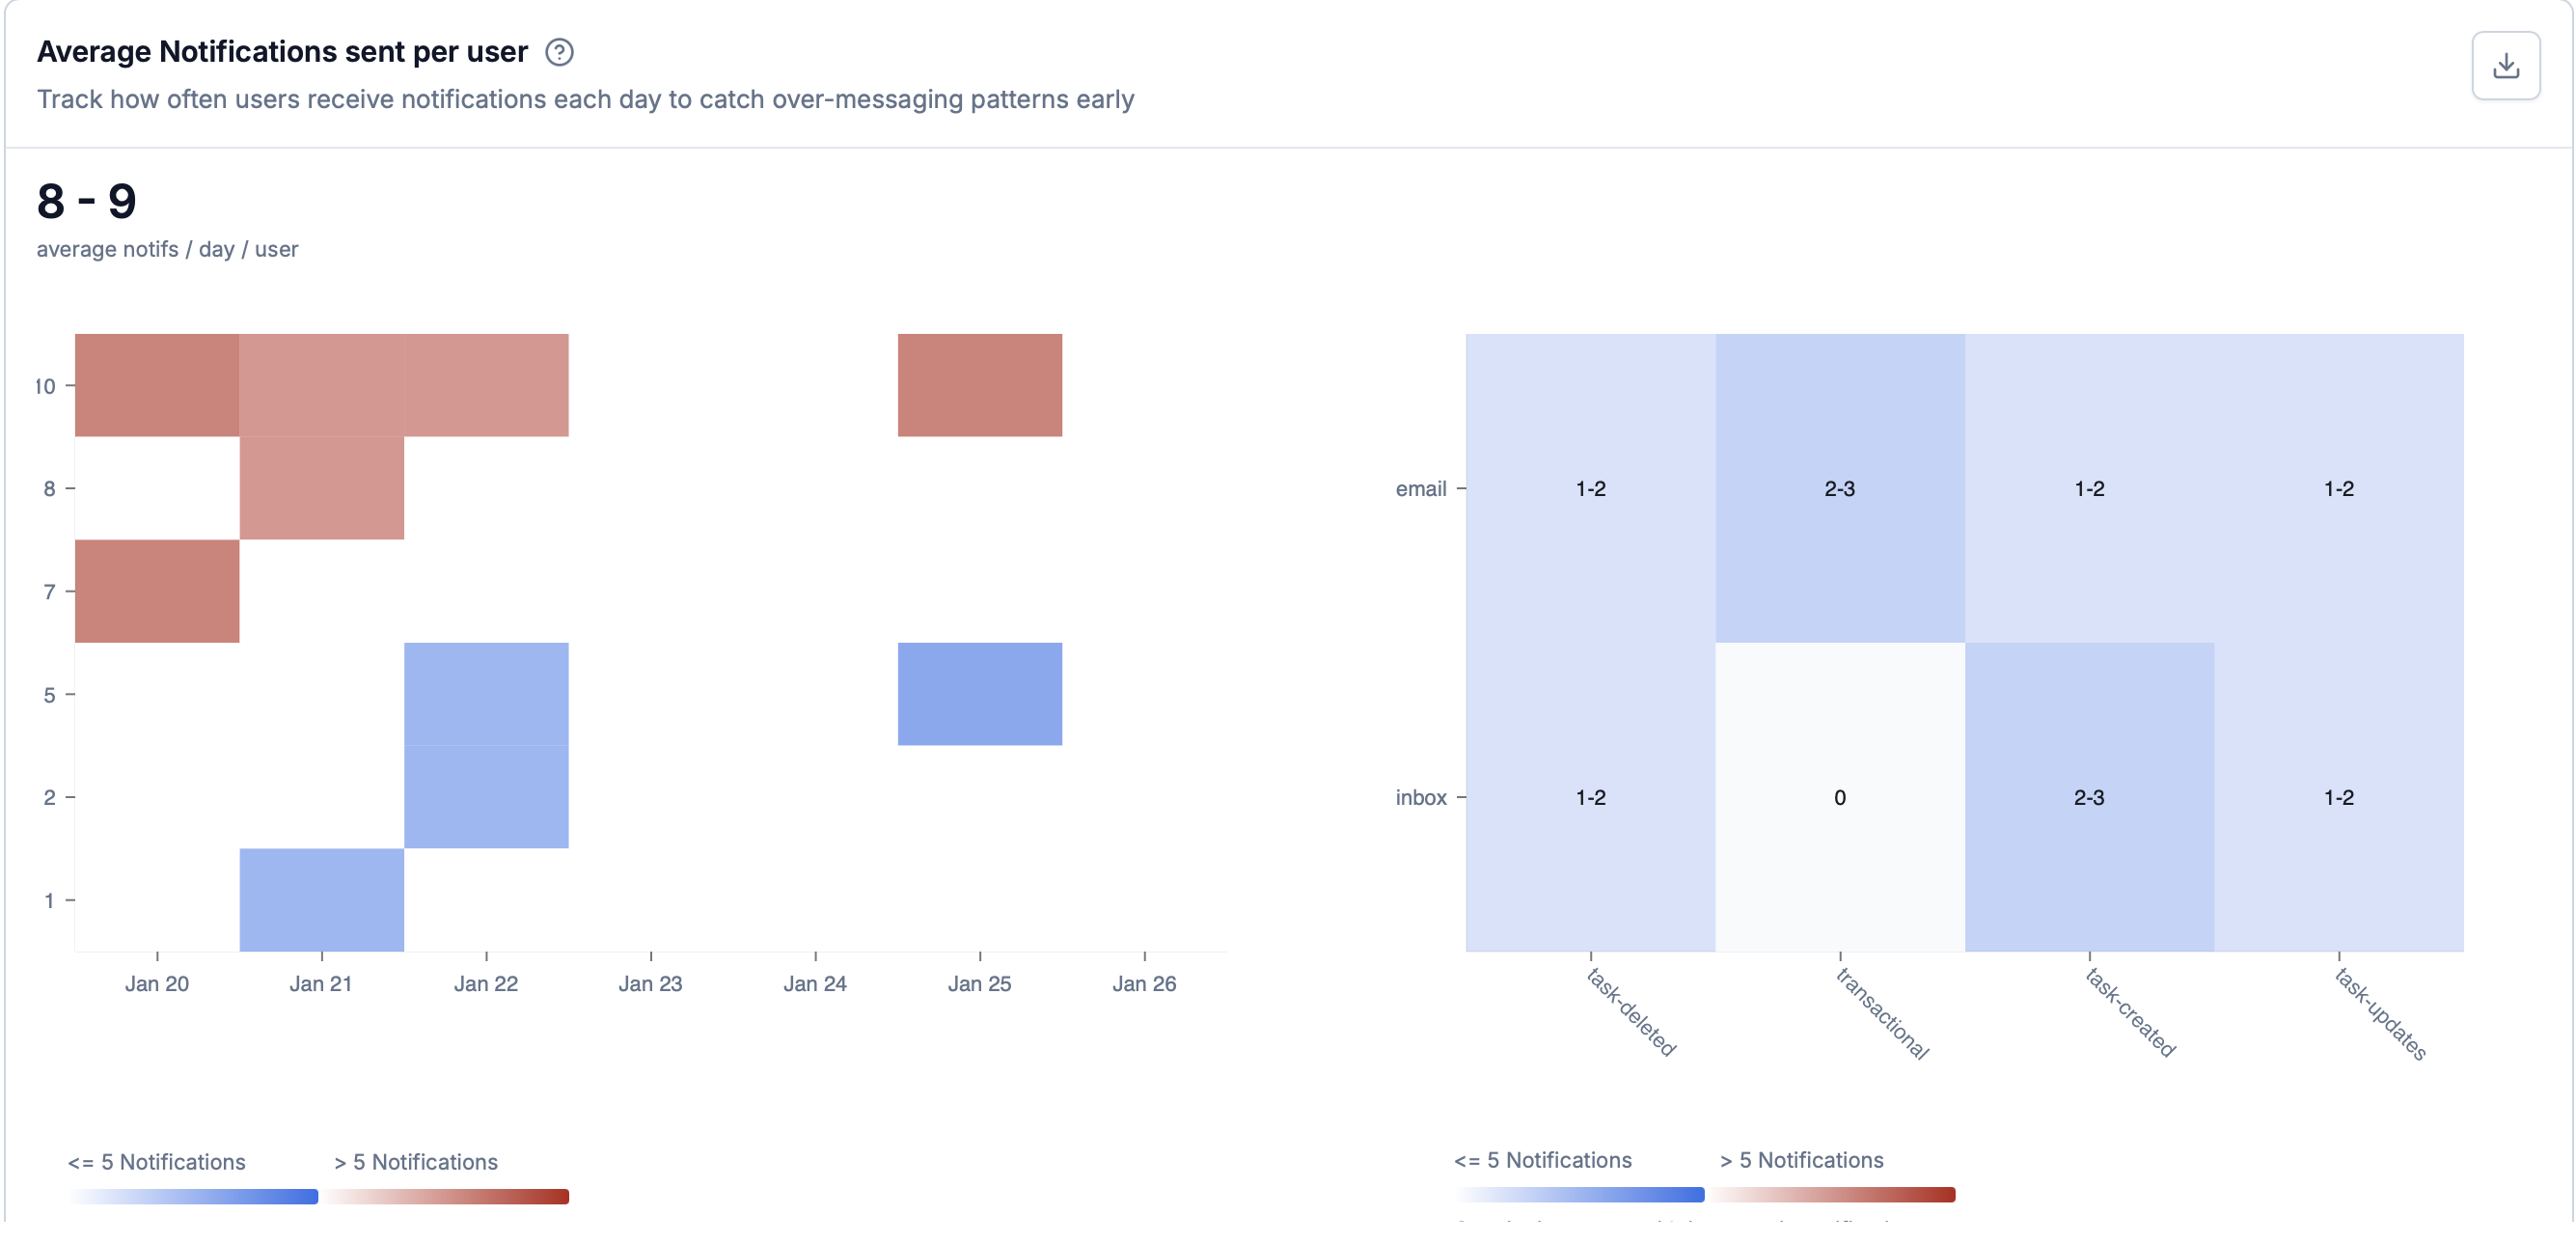 Use this view to spot over-messaging before opt-outs spike. The following breakdown explains what you're looking at.
**What you'll see:**
* **Average notifications per user** - Average number of notifications each user receives per day. You can notification bucket vs %of users in each bucket. Anything in the red zone is considered over-messaging and you should try to keep the notification volume in the blue zone.
* **Volume trends over time** - How notification volume changes over time
* **Volume by category** - Which preference categories contribute most to total volume
* **Volume by channel** - Which channels are sending the most notifications
These ranges are general guidelines. Transaction-heavy products may legitimately exceed them. Monitor your opt-out rates to determine what works for your users.
**Reducing volume:**
* Use [throttling](/docs/throttle) to limit how often workflows trigger per user
* Use [batch](/docs/batch) to consolidate multiple updates into single notifications
* Use [smart channel routing](/docs/smart-delivery) to stop delivery on further channels when a user engages with the notification on any one channel.
* If you're sending broadcast or promotional notifications, reduce the frequency of sending them.
* Use [preference categories](/docs/managing-notification-categories) to let users manage preferences per category-prevents complete channel opt-outs and highlights where to reduce volume.
***
#### Unsubscription trends
Monitor opt-outs by channel, category, and time period to understand what is driving your users to opt out.
**User preferences required:** This tracking will be available only when you use SuprSend's [preferences capabilities](/docs/user-preferences).
Use this view to spot over-messaging before opt-outs spike. The following breakdown explains what you're looking at.
**What you'll see:**
* **Average notifications per user** - Average number of notifications each user receives per day. You can notification bucket vs %of users in each bucket. Anything in the red zone is considered over-messaging and you should try to keep the notification volume in the blue zone.
* **Volume trends over time** - How notification volume changes over time
* **Volume by category** - Which preference categories contribute most to total volume
* **Volume by channel** - Which channels are sending the most notifications
These ranges are general guidelines. Transaction-heavy products may legitimately exceed them. Monitor your opt-out rates to determine what works for your users.
**Reducing volume:**
* Use [throttling](/docs/throttle) to limit how often workflows trigger per user
* Use [batch](/docs/batch) to consolidate multiple updates into single notifications
* Use [smart channel routing](/docs/smart-delivery) to stop delivery on further channels when a user engages with the notification on any one channel.
* If you're sending broadcast or promotional notifications, reduce the frequency of sending them.
* Use [preference categories](/docs/managing-notification-categories) to let users manage preferences per category-prevents complete channel opt-outs and highlights where to reduce volume.
***
#### Unsubscription trends
Monitor opt-outs by channel, category, and time period to understand what is driving your users to opt out.
**User preferences required:** This tracking will be available only when you use SuprSend's [preferences capabilities](/docs/user-preferences).
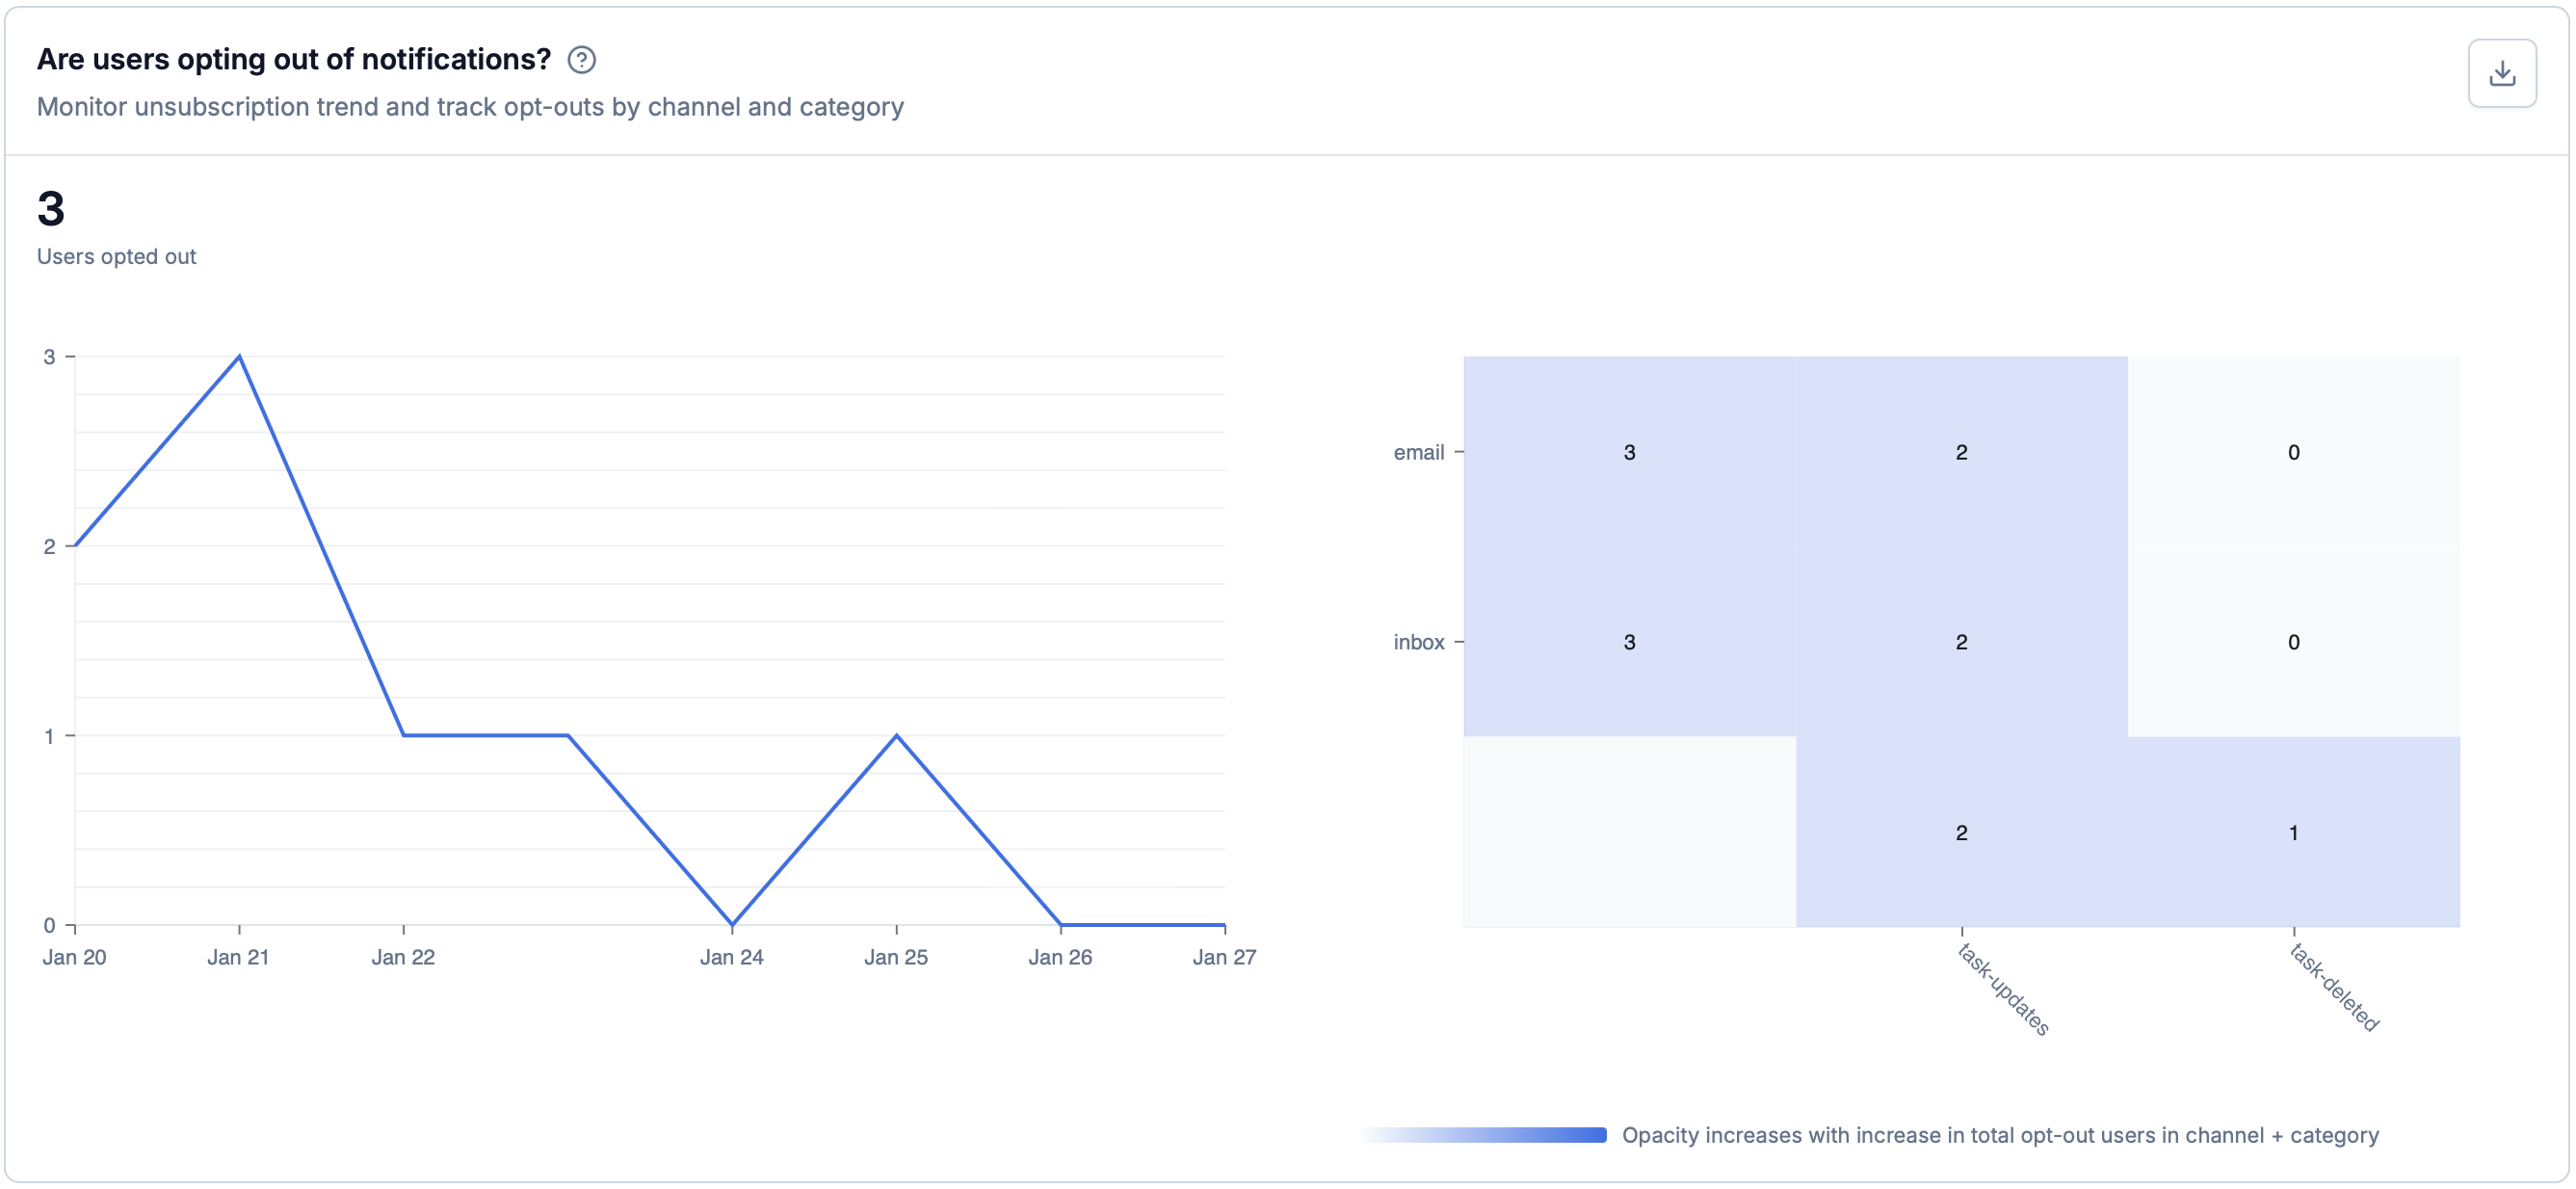 **What you'll see:**
* **Total opt-outs** - Number and percentage of users who unsubscribed
* **Day-wise trends** - Opt-out patterns over time (use available time breakdowns to spot spikes)
* **Category breakdown** - Which categories drive the most opt-outs
* **Channel breakdown** - Which channels contribute most to opt-outs
Watch for: Opt-out rate above 0.5%, spikes in opt-outs for specific categories, high opt-outs from a single channel, or opt-out rates increasing over time
**Investigate the opt-outs:**
1. **Check notification volume first** - Over-messaging is the most common cause. Check if volume trends correlate with opt-out spikes.
2. **Filter by category or channel** - Identify which categories or channels have the highest opt-out rates and then optimize the volume or content of the notifications.
3. **Analyze day-wise trends** - Check if opt-outs spiked after a specific campaign or change.
Over-messaging. Reduce frequency.
Content or relevance issue. Review what you're sending.
That campaign is the problem. Review its content and frequency.
Users prefer other channels. Adjust channel strategy.
Use filters (category/channel/workflow) to isolate drivers. Export raw user data for deeper analysis.
***
### Workflow Level Breakdown
The Workflow Level Breakdown helps you compare notification performance **at the most actionable level** - individual workflows, templates, channels, and vendors.
**What you'll see:**
* **Total opt-outs** - Number and percentage of users who unsubscribed
* **Day-wise trends** - Opt-out patterns over time (use available time breakdowns to spot spikes)
* **Category breakdown** - Which categories drive the most opt-outs
* **Channel breakdown** - Which channels contribute most to opt-outs
Watch for: Opt-out rate above 0.5%, spikes in opt-outs for specific categories, high opt-outs from a single channel, or opt-out rates increasing over time
**Investigate the opt-outs:**
1. **Check notification volume first** - Over-messaging is the most common cause. Check if volume trends correlate with opt-out spikes.
2. **Filter by category or channel** - Identify which categories or channels have the highest opt-out rates and then optimize the volume or content of the notifications.
3. **Analyze day-wise trends** - Check if opt-outs spiked after a specific campaign or change.
Over-messaging. Reduce frequency.
Content or relevance issue. Review what you're sending.
That campaign is the problem. Review its content and frequency.
Users prefer other channels. Adjust channel strategy.
Use filters (category/channel/workflow) to isolate drivers. Export raw user data for deeper analysis.
***
### Workflow Level Breakdown
The Workflow Level Breakdown helps you compare notification performance **at the most actionable level** - individual workflows, templates, channels, and vendors.
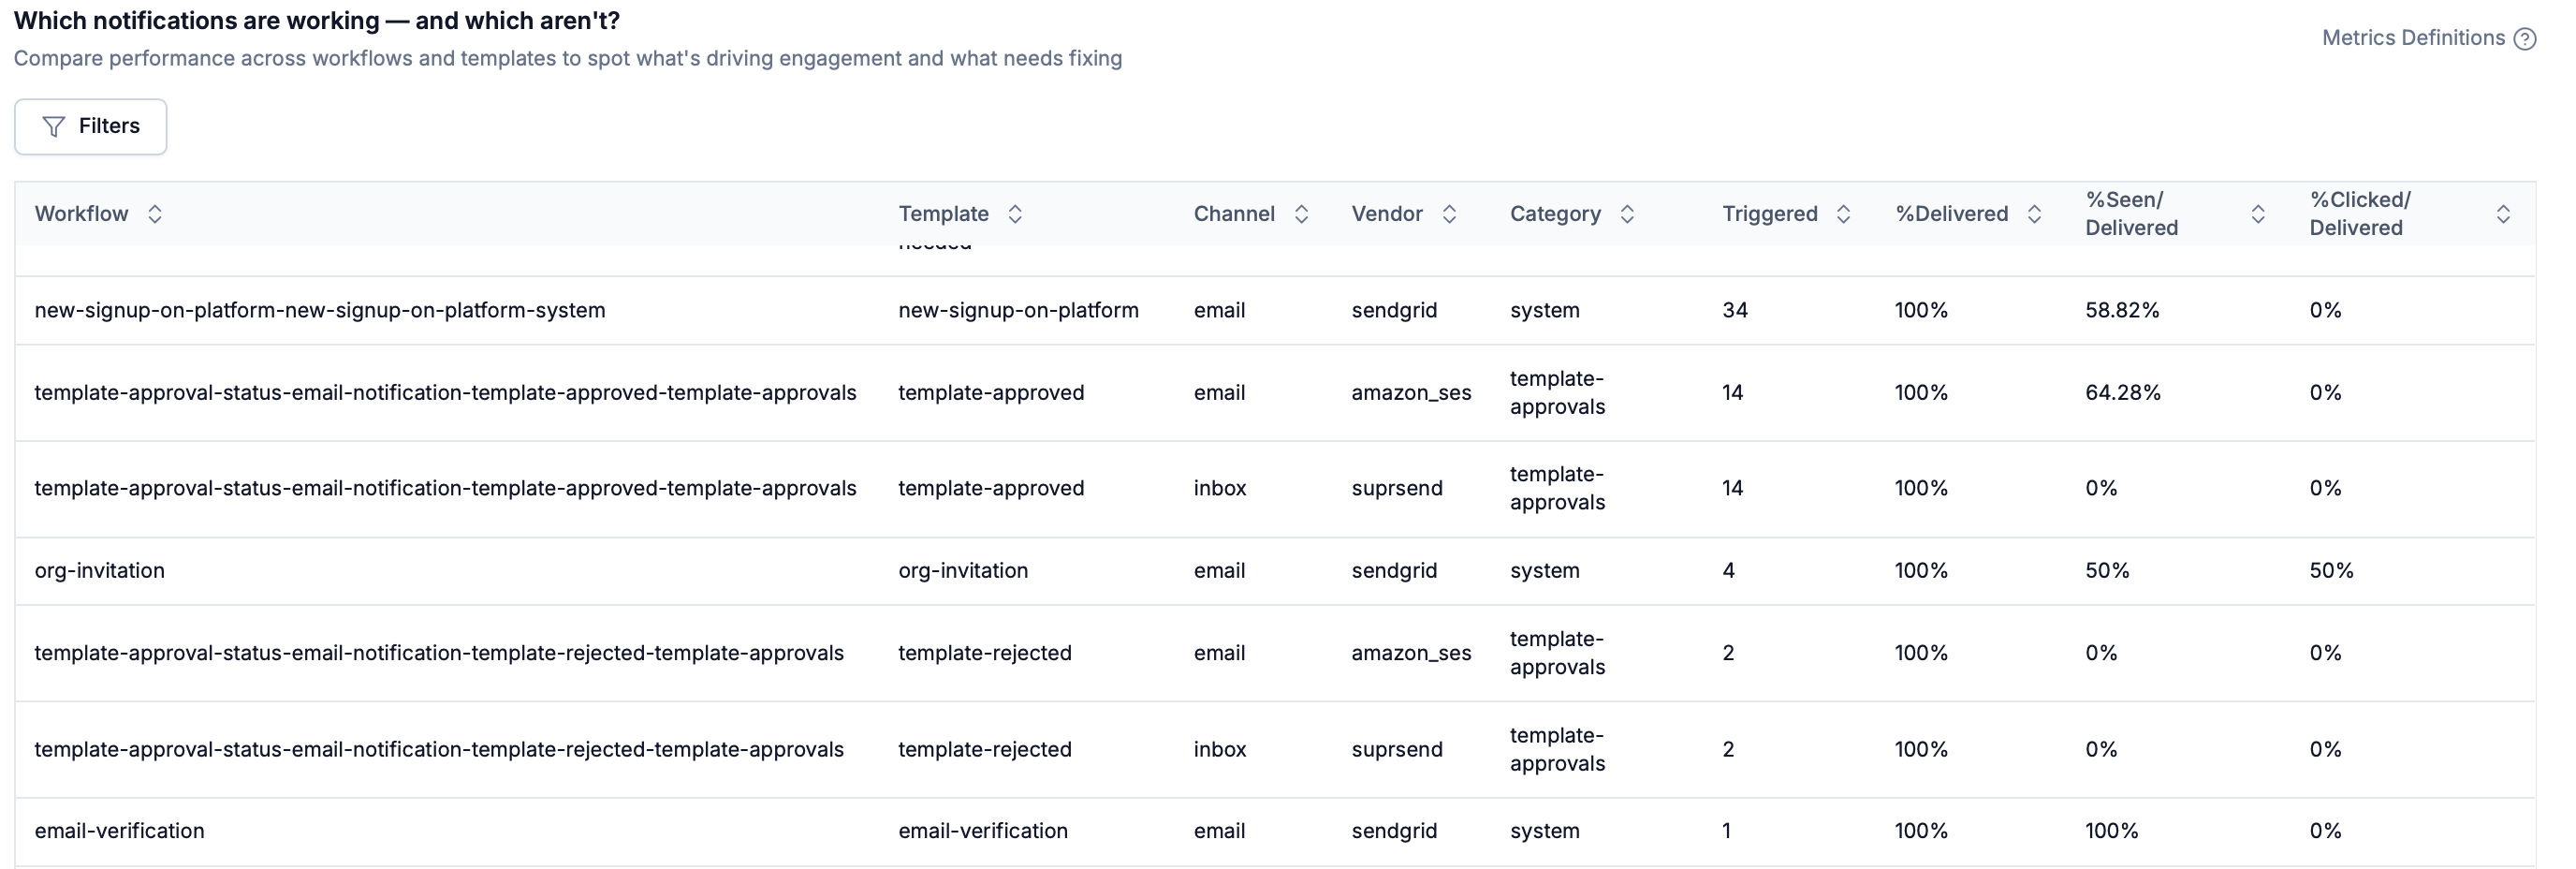 Each row shows notification performance indicators for a specific workflow, template, channel, vendor and category.
**Metrics shown:**
| Column | Meaning |
| ------------------------- | ---------------------------------------------------------------------------------- |
| **Triggered** | # of notification requests triggered or sent to vendor via SuprSend |
| **% Delivered** | Percentage of triggered notifications that was delivered to the end user |
| **% Seen / Delivered** | Percentage of delivered notifications that were opened or viewed (where supported) |
| **% Clicked / Delivered** | Percentage of delivered notifications that were clicked (where supported) |
Each row shows notification performance indicators for a specific workflow, template, channel, vendor and category.
**Metrics shown:**
| Column | Meaning |
| ------------------------- | ---------------------------------------------------------------------------------- |
| **Triggered** | # of notification requests triggered or sent to vendor via SuprSend |
| **% Delivered** | Percentage of triggered notifications that was delivered to the end user |
| **% Seen / Delivered** | Percentage of delivered notifications that were opened or viewed (where supported) |
| **% Clicked / Delivered** | Percentage of delivered notifications that were clicked (where supported) |
**Filters:**
Other than the global filters (workflow, tenant, date range), you can also filter by all table columns locally - channel, vendor, category and template.
**Sorting:**
Click any column header to sort. Sort by lowest seen/click rate to find underperformers, highest to find top performers, or trigger count for high-volume workflows.
**What to look for:**
1. **Identify top performers**
* Sort by **% Seen / Delivered** or **% Clicked / Delivered** (descending)
* Look for patterns in channel, timing, or template design
* Reuse successful patterns across similar workflows
2. **Identify underperformers**
* Sort by **% Seen / Delivered** or **% Clicked / Delivered** (ascending)
* Compare against similar workflows in the same category
* Check whether the issue is content, channel choice, timing or frequency of sending
3. **Identify issues with delivery**
* Low **% Delivered** indicates delivery or vendor issues
* Click through to the Errors tab to investigate notification delivery failures and fix them.
4. **Compare channels for the same workflow**
If you are sending on multiple channels for the same workflow,
* Compare engagement rates side by side
* Decide whether certain channels should be deprioritized or removed
* Consider using [smart delivery](/docs/smart-delivery) to automatically choose the best channel
***
### Errors
The Errors tab helps you identify and resolve issues that prevent notifications from being triggered, executed, or delivered. Unlike Logs (which show every event), Errors aggregates failures so you can quickly spot issues and prioritize fixes.
You'll see errors grouped into three sections:
Errors where API or SDK requests were not successfully processed. Workflow execution will not start for failed requests.
Errors while running workflows or broadcasts. Message logs could still show for these cases for successful step execution.
Vendor-reported delivery issues and couldn't deliver the notification to the end user.
#### API Request Failures
Errors where API or SDK requests were not successfully processed, and **no workflow execution was started**.
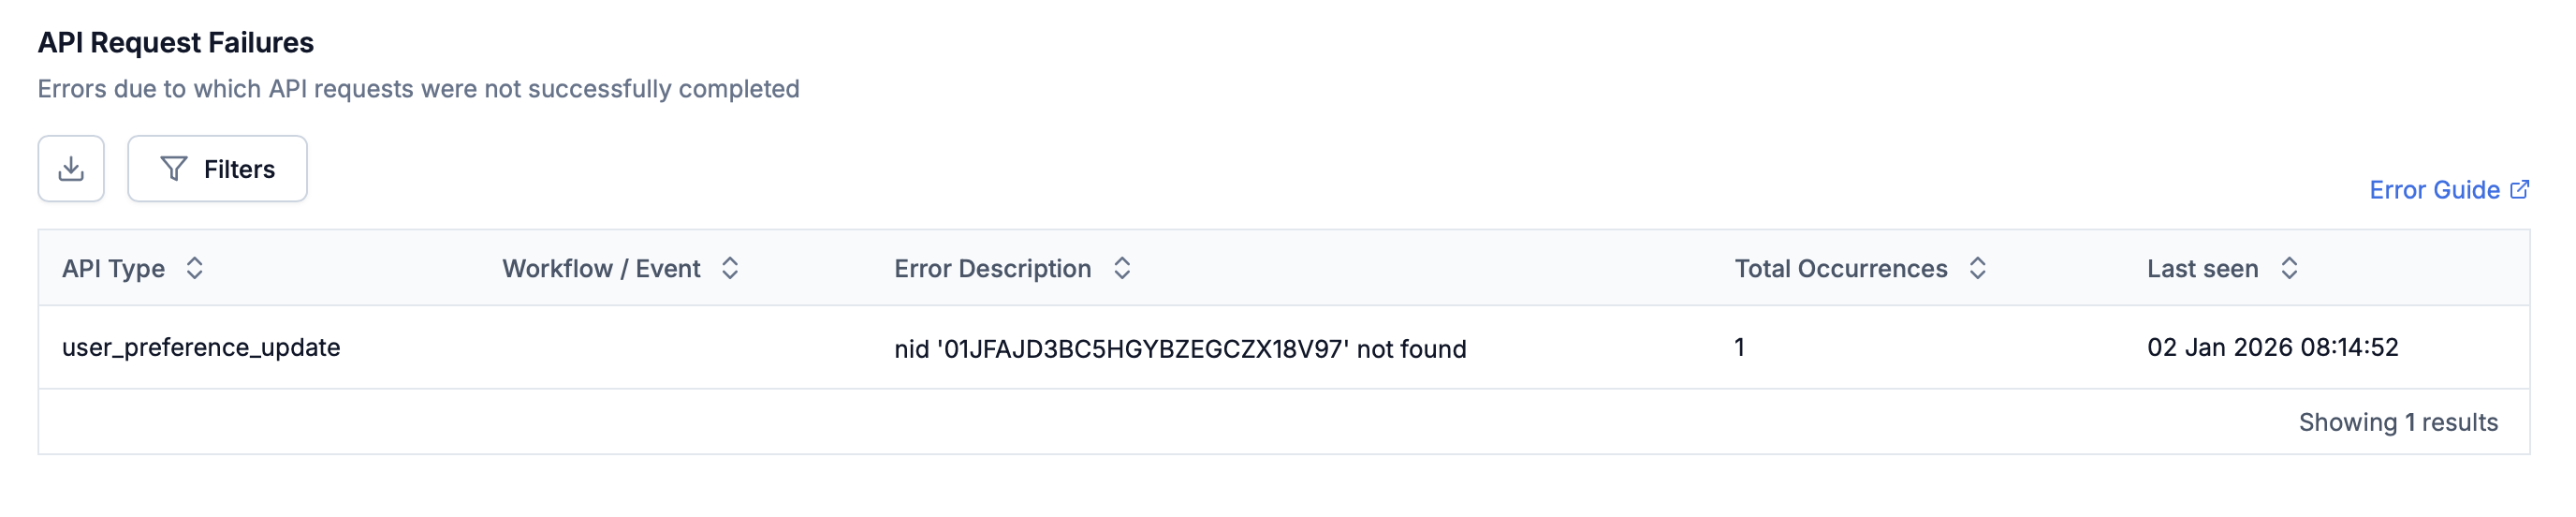 If this error table is empty and you're actively sending requests, your integration is working as expected.
**What you'll see:**
* **Total occurrences** - How often the error occurred in the selected time range
* **Last seen** - When the error last happened (to see if it's ongoing)
* **Context** - API type or request context involved
* **Error description** - The exact error message reported
**Common causes:**
* Invalid or expired API key
* Authentication failure
* Missing required fields (for example `user_id`)
* Invalid request payload format
**Filters:** API type, error description. **Sortable.**
***
#### Workflow / Broadcast Execution Failures
Errors that occur **after a request is accepted**, but while executing a workflow or broadcast.
These usually indicate issues with workflow configuration or template data.
If this error table is empty and you're actively sending requests, your integration is working as expected.
**What you'll see:**
* **Total occurrences** - How often the error occurred in the selected time range
* **Last seen** - When the error last happened (to see if it's ongoing)
* **Context** - API type or request context involved
* **Error description** - The exact error message reported
**Common causes:**
* Invalid or expired API key
* Authentication failure
* Missing required fields (for example `user_id`)
* Invalid request payload format
**Filters:** API type, error description. **Sortable.**
***
#### Workflow / Broadcast Execution Failures
Errors that occur **after a request is accepted**, but while executing a workflow or broadcast.
These usually indicate issues with workflow configuration or template data.
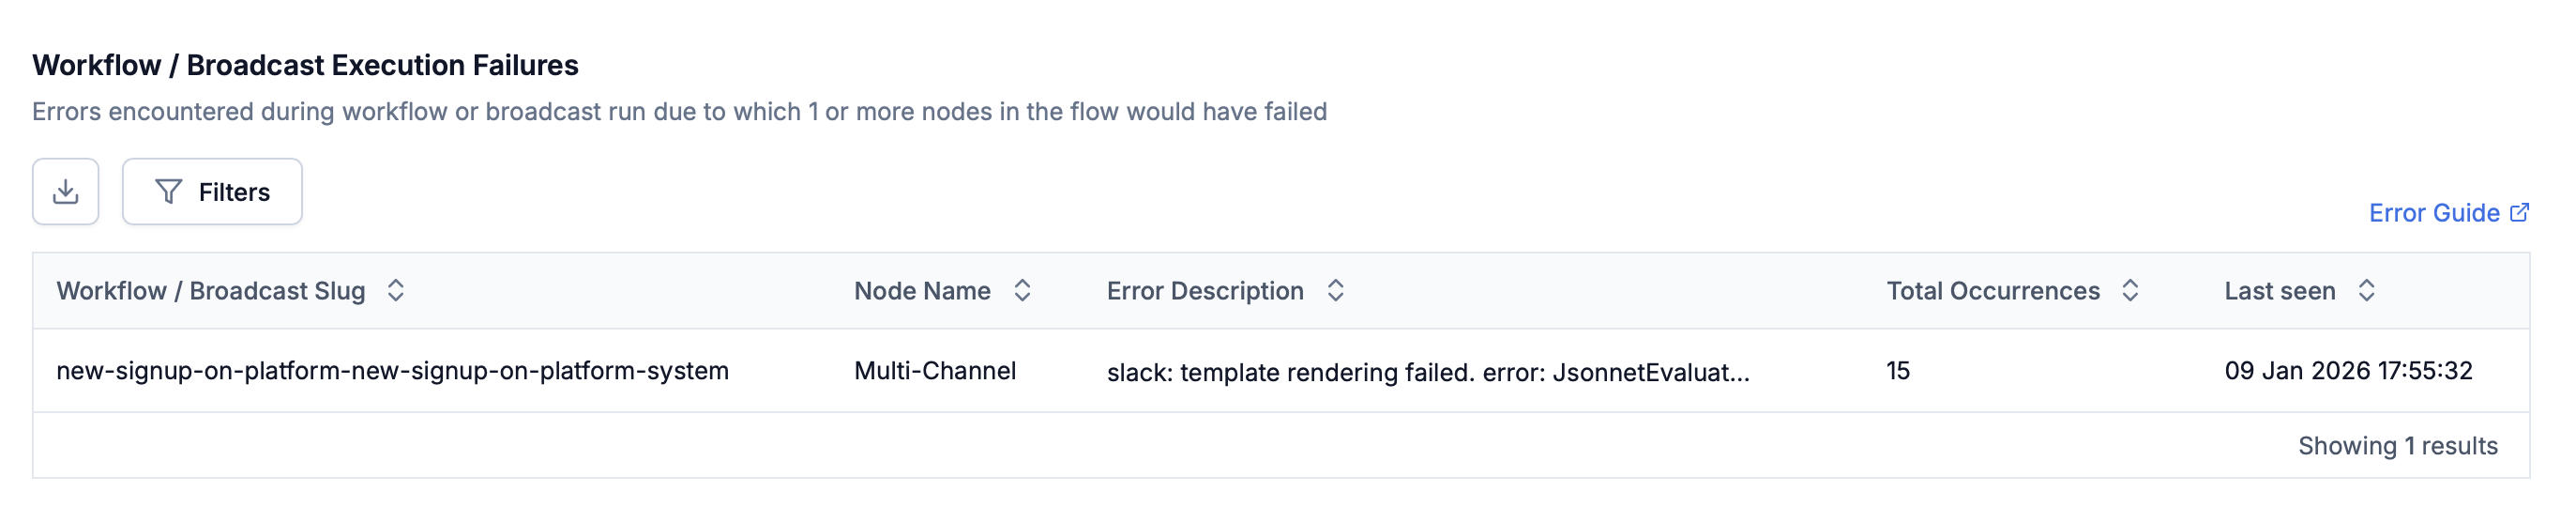 Each row represents a workflow (or broadcast) and the node where execution failed.
**What you'll see:**
* **Total occurrences** - How often the error occurred in the selected time range
* **Last seen** - When the error last happened (to see if it's ongoing)
* **Workflow** - The workflow where the failure occurred
* **Node Name** - The specific node in the workflow where execution failed
* **Error description** - The exact error message reported
**Most common errors:**
* Template rendering failures due to missing variables
* Dynamic fields in workflow couldn't be evaluated due to missing data or invalid data types
If the same error appears multiple times with a high occurrence count, it indicates a systemic issue affecting many notifications.
**Filters:** Workflow and Tenant (Global filter), Node name, error description. **Sortable.**
#### Notification Delivery Failures
Errors reported by vendors **after SuprSend successfully sent the request**, but the vendor could not deliver the notification.
Each row represents a workflow (or broadcast) and the node where execution failed.
**What you'll see:**
* **Total occurrences** - How often the error occurred in the selected time range
* **Last seen** - When the error last happened (to see if it's ongoing)
* **Workflow** - The workflow where the failure occurred
* **Node Name** - The specific node in the workflow where execution failed
* **Error description** - The exact error message reported
**Most common errors:**
* Template rendering failures due to missing variables
* Dynamic fields in workflow couldn't be evaluated due to missing data or invalid data types
If the same error appears multiple times with a high occurrence count, it indicates a systemic issue affecting many notifications.
**Filters:** Workflow and Tenant (Global filter), Node name, error description. **Sortable.**
#### Notification Delivery Failures
Errors reported by vendors **after SuprSend successfully sent the request**, but the vendor could not deliver the notification.
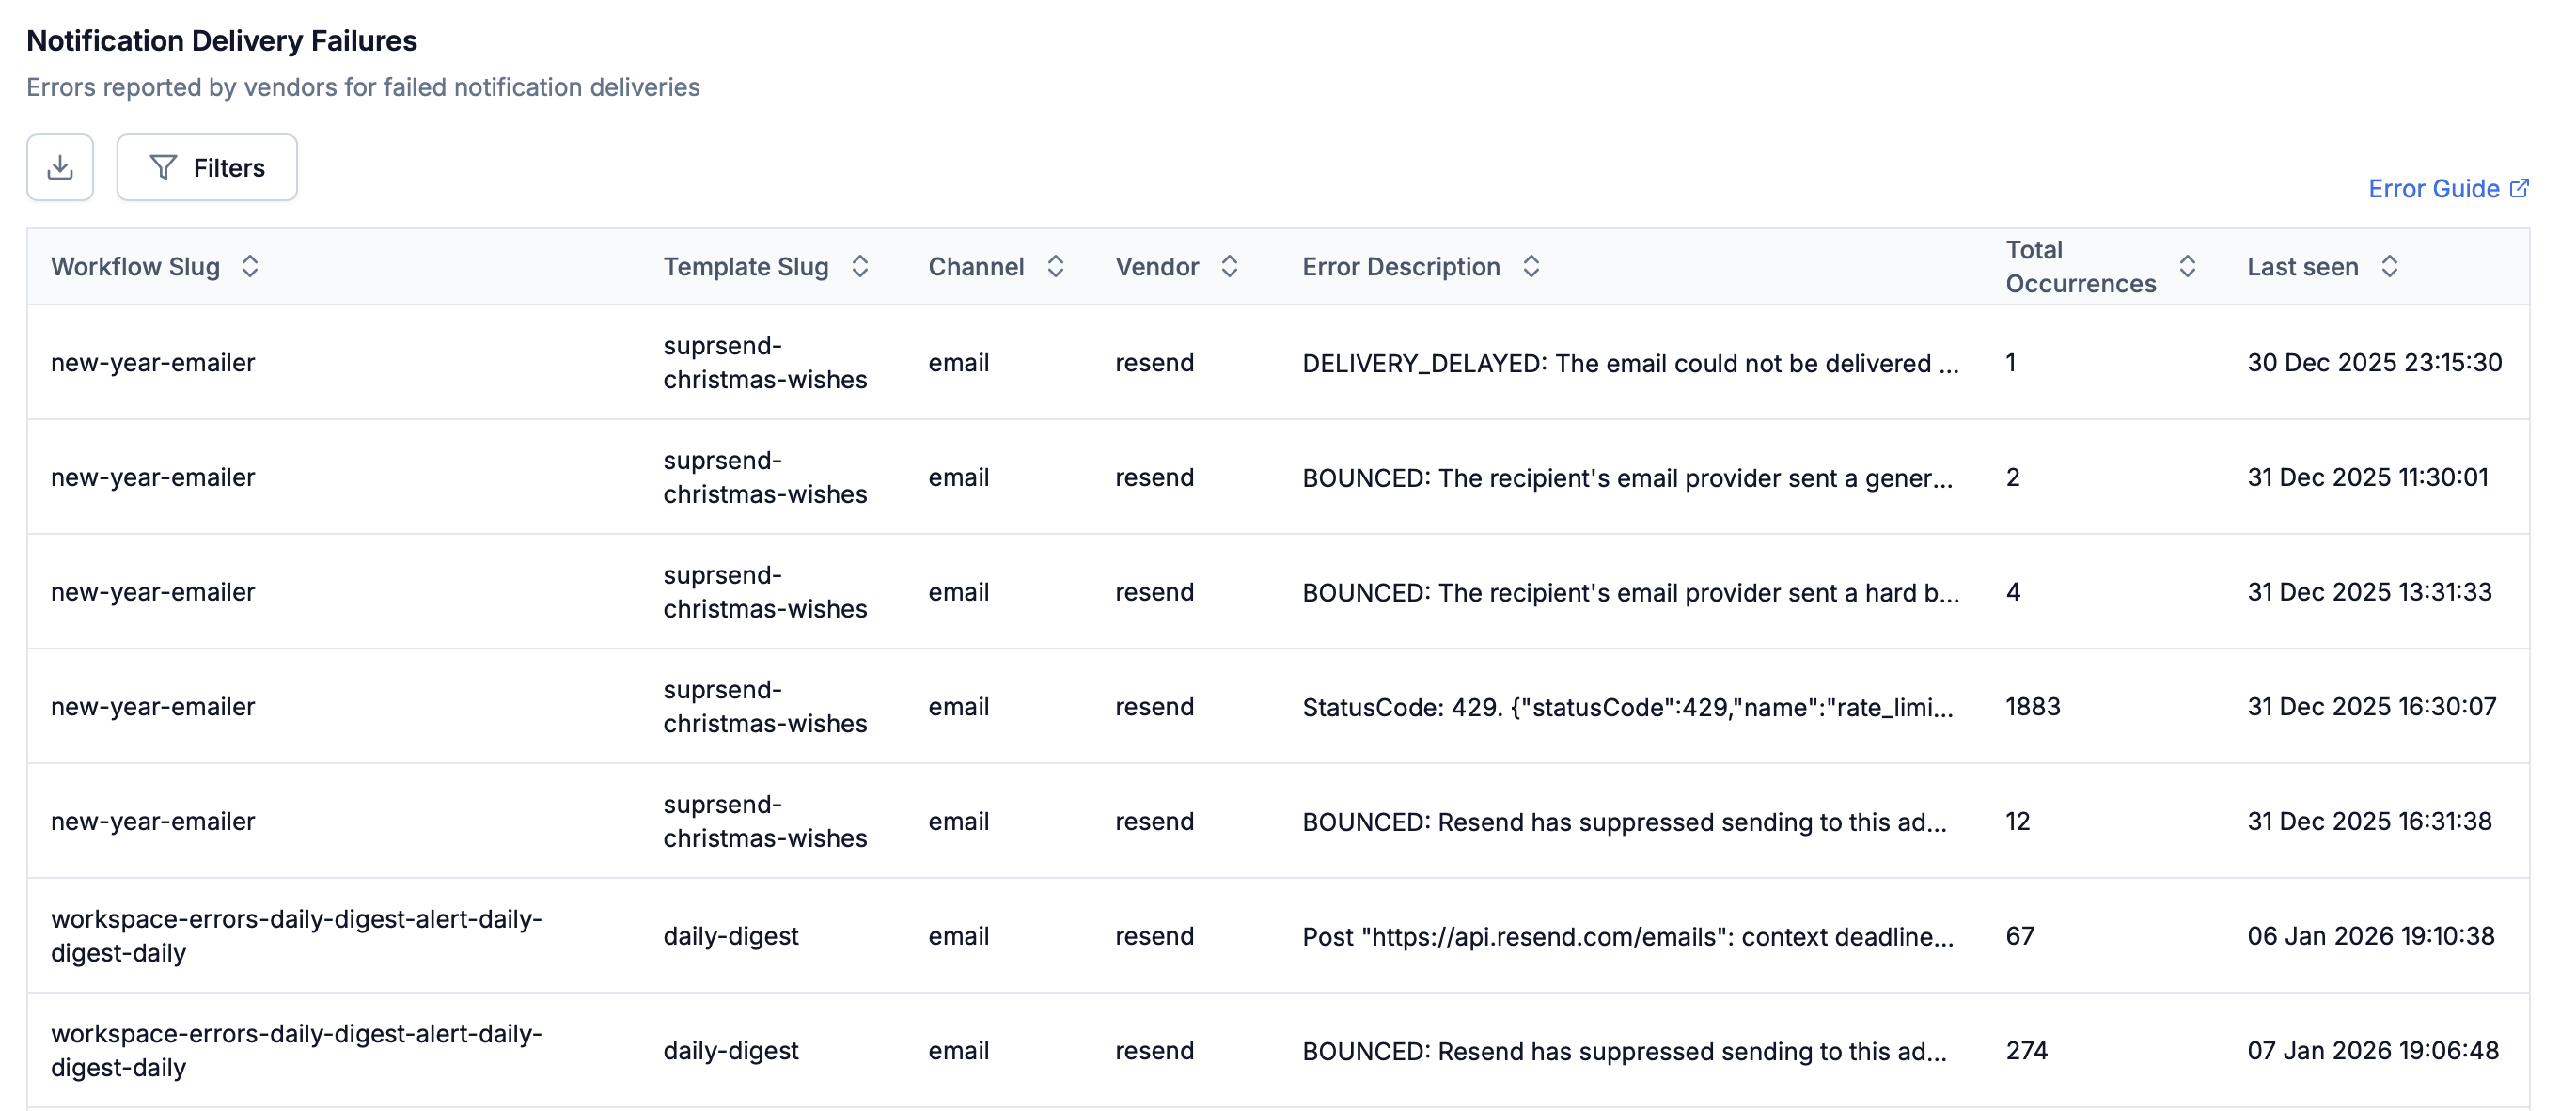 **What you'll see:**
* **Total occurrences** - How often the error occurred in the selected time range
* **Last seen** - When the error last happened (to see if it's ongoing)
* **Template** - The template slug for the failed notification
* **Channel** - The channel where delivery failed (email, SMS, push, etc.)
* **Vendor** - The vendor that reported the delivery failure
* **Error description** - The exact error message reported
**Common delivery errors:**
* User channel identities are invalid, blocked or missing
* Vendor-side rate limiting
* Credit limit exceeded
* Temporary vendor outages
Some delivery failures (like invalid addresses) require fixing user data. Others (like temporary outages) may resolve automatically.
**Filters:** Workflow and Tenant (Global filter), Template slug, channel, vendor, error description. **Sortable.**
If errors persist or you're unsure how to resolve a specific failure, see the [Error Guide](/docs/error-guides) or contact support.
***
## Exporting data
Export CSVs for analysis outside SuprSend (Sheets/Excel/Data warehouse).
**Summary:** You can export upto 50 million rows per file. If your export exceeds 50M rows, SuprSend automatically splits it into multiple files with `partition_id` column telling you the file number.
**How to export:**
**What you'll see:**
* **Total occurrences** - How often the error occurred in the selected time range
* **Last seen** - When the error last happened (to see if it's ongoing)
* **Template** - The template slug for the failed notification
* **Channel** - The channel where delivery failed (email, SMS, push, etc.)
* **Vendor** - The vendor that reported the delivery failure
* **Error description** - The exact error message reported
**Common delivery errors:**
* User channel identities are invalid, blocked or missing
* Vendor-side rate limiting
* Credit limit exceeded
* Temporary vendor outages
Some delivery failures (like invalid addresses) require fixing user data. Others (like temporary outages) may resolve automatically.
**Filters:** Workflow and Tenant (Global filter), Template slug, channel, vendor, error description. **Sortable.**
If errors persist or you're unsure how to resolve a specific failure, see the [Error Guide](/docs/error-guides) or contact support.
***
## Exporting data
Export CSVs for analysis outside SuprSend (Sheets/Excel/Data warehouse).
**Summary:** You can export upto 50 million rows per file. If your export exceeds 50M rows, SuprSend automatically splits it into multiple files with `partition_id` column telling you the file number.
**How to export:**
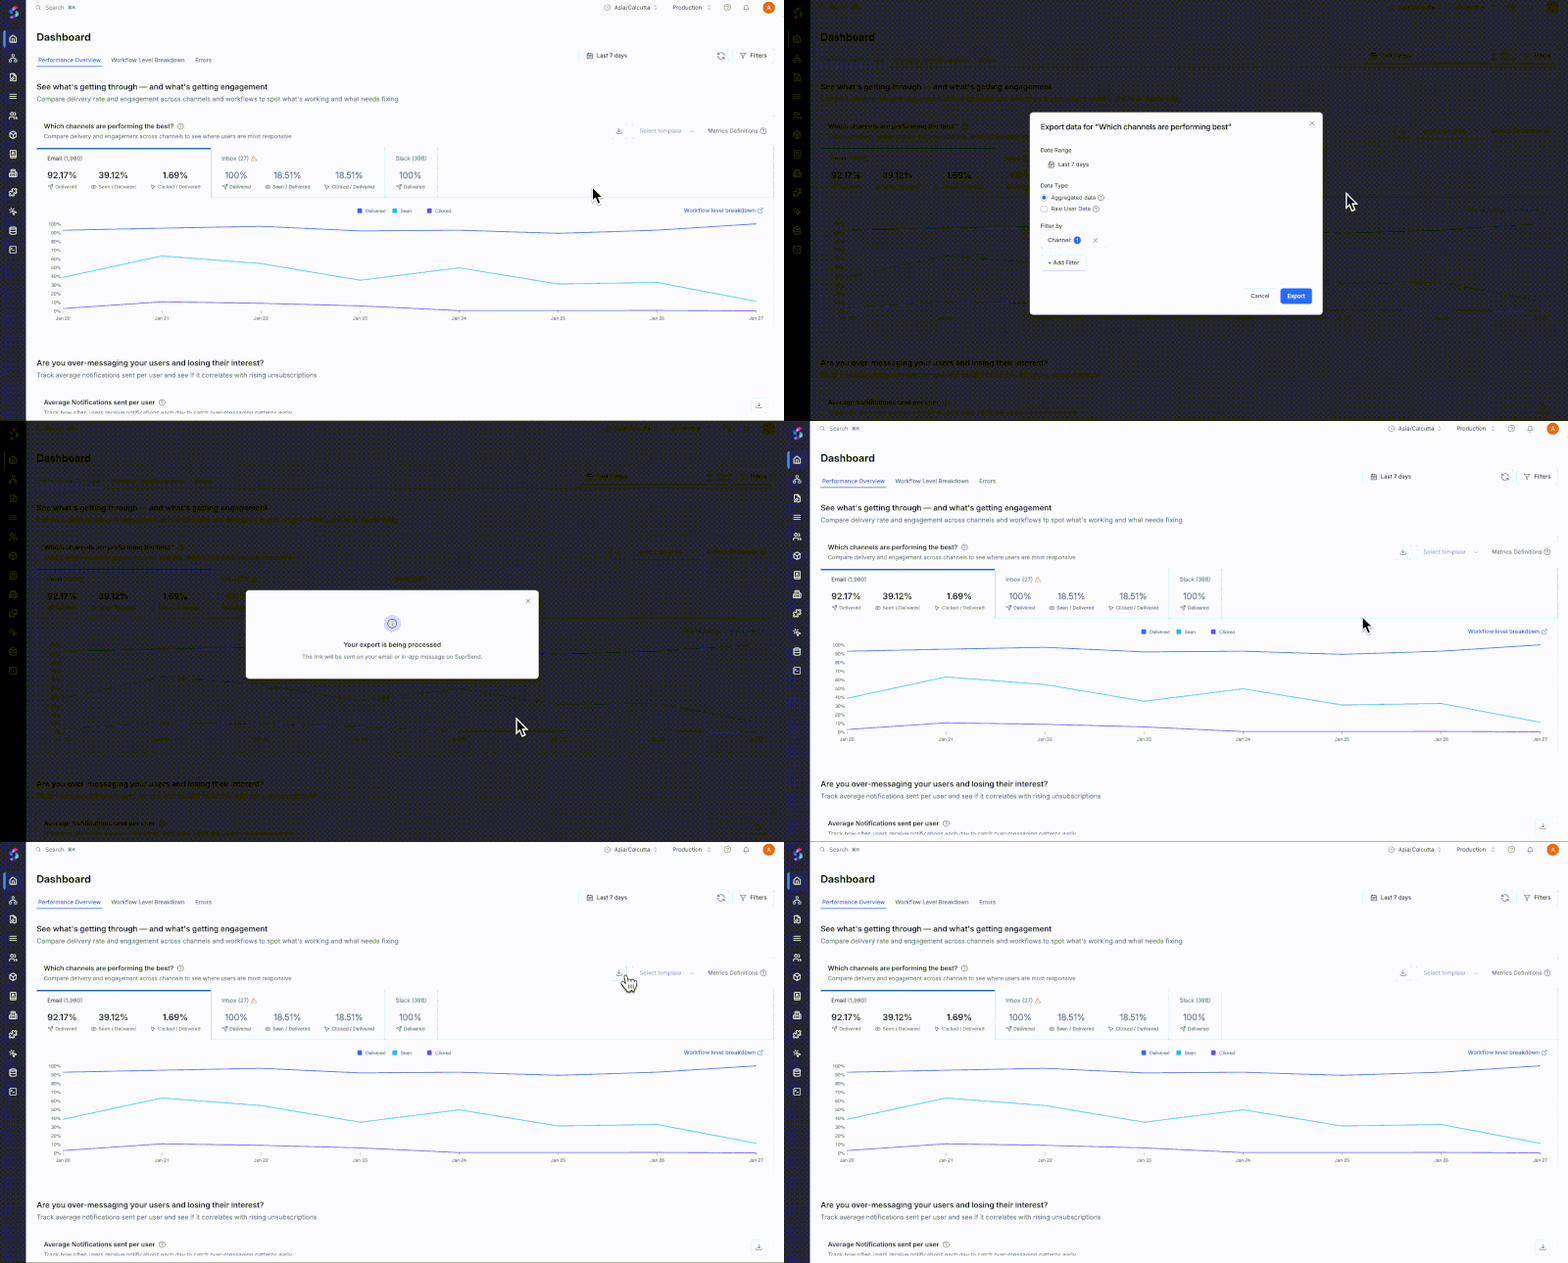 1. Navigate to the data point you want to export
2. Click the 📥 icon in the top right of that section
3. Select your date range (relative or absolute)
4. Choose your export type (aggregate or raw user data)
5. Apply any filters you want to include
6. Download the CSV file(s)
1. Navigate to the data point you want to export
2. Click the 📥 icon in the top right of that section
3. Select your date range (relative or absolute)
4. Choose your export type (aggregate or raw user data)
5. Apply any filters you want to include
6. Download the CSV file(s)
**Export types:**
**Aggregate user data** - Summary statistics grouped by date and time (matches what you see in charts). Includes: Date/time buckets, total counts, percentage rates, grouped by workflow/channel/category/vendor/template. Use cases: Custom dashboards, trend analysis, high-level reporting.
**Raw user data** - Individual user-level records with timestamps for available events. Includes: User records, timestamps for each event, workflow/template/channel/vendor/category, user properties and metadata. Use cases: Check each log, detailed user behavior analysis, and drilldown into trends to identify patterns.
***
## Navigating Analytics
### Refresh
Analytics data updates automatically every 5 minutes. You can manually refresh the data by clicking the refresh button to get the latest metrics.
### Filters
You have global filters to drill down analytics data by workflow, tenant, and date range. Other than this, local filters are available for against respective data point to filter by channel, vendor, category, node, error description and template.
### Date Range and Retention
Analytics default to "Last 7 days" when first opened. Choose from relative ranges (Last 1 day, 7 days, 30 days, and additional presets) or select absolute date ranges with timezone-aware selection.
Data retention period is based on your [pricing plan](https://www.suprsend.com/pricing). For extended retention options, contact our [sales team](mailto:sales@suprsend.com).
***
## Frequently Asked Questions
Analytics data updates in near real-time, usually within a few minutes of events occurring. We cache the data for 5 minutes after last refresh.
For immediate verification of a specific event, use [Logs](/docs/logging) instead.
Analytics automatically uses your browser's timezone by default. You can change the timezone in the top navbar if you need to view data in a different timezone.
It could be because the data retention period for your pricing plan is shorter than 90 days. Check the [pricing page](https://www.suprsend.com/pricing) for specific retention periods for your pricing plan.
If you see "seen" or "clicked" metrics showing as 0% or missing for channels that support them, here are the most common causes:
* **Tracking not configured:** Configure the webhook URL `https://hub.suprsend.com/webhook/*` in your vendor account. See [vendor integration docs](/docs/vendors) for step-by-step instructions
* **Vendor has not sent engagement events:** There might be some delay in vendor reporting the engagement events. You can wait for some time and check again. If the issue persists, contact your vendor or SuprSend support.
* **Channel limitation:** Some channels (SMS, Slack, MS Teams) don't support seen/clicked metrics-this is expected
High opt-out rates usually indicate over-messaging or the user doesn't find value in the notification. See what categories or channels are contributing to the high opt-out rate and optimize the workflows in those categories or in general check if you are over-messaging the users. See the [Unsubscription trends](#unsubscription-trends) section for detailed investigation steps and the [Notification volume](#notification-volume) section for reducing frequency.
Analytics numbers change because vendors send status updates over time. This is normal behavior as users can open or click on the notification at any time.
Need help? [Contact our support team](mailto:support@suprsend.com).