> ## Documentation Index
> Fetch the complete documentation index at: https://docs.suprsend.com/llms.txt
> Use this file to discover all available pages before exploring further.
# New Relic
> Stream SuprSend notification metrics to New Relic via OpenTelemetry OTLP to monitor API requests, delivery, and engagement with under a minute latency.
The SuprSend New Relic connector streams notification metrics to your New Relic account via [OpenTelemetry (OTLP)](https://opentelemetry.io/) in near real-time - with latency under **1 minute**. It covers three key areas of your notification pipeline:
Track every API call hitting SuprSend - success/failure counts, error breakdowns, and request volume over time.
Monitor workflow performance, catch execution errors early, and identify top failing workflows.
Follow the full message lifecycle - triggered, delivered, seen, clicked - with delivery errors by vendor and channel.
**Enterprise plan feature.** The SuprSend New Relic connector is only available on our [Enterprise plan](https://suprsend.com/pricing).
## How it works
SuprSend exports `suprsend.*` metrics to New Relic via OTLP over HTTP or gRPC. You provide your **New Relic OTLP endpoint** and **license API key**, choose which events to sync, and SuprSend streams them in near real-time - with latency **under 1 minute**.
Once connected you can **build custom dashboards**, **set up alerts** for delivery failures or API errors, **slice by any dimension** (workspace, tenant, workflow, channel, vendor, template), and **correlate notification health with your infrastructure and APM data** in New Relic.
All metrics are tagged by workspace, tenant, workflow, category, channel, vendor, template, node, and error details. See [Reported metrics](#reported-metrics) for the full list.
Please refer to your New Relic pricing agreement for information on how custom metrics sent to New Relic are priced for your account.
***
## Installing the connector
In your SuprSend dashboard, navigate to [**Connectors**](https://app.suprsend.com/connectors) and click **New Connector**.
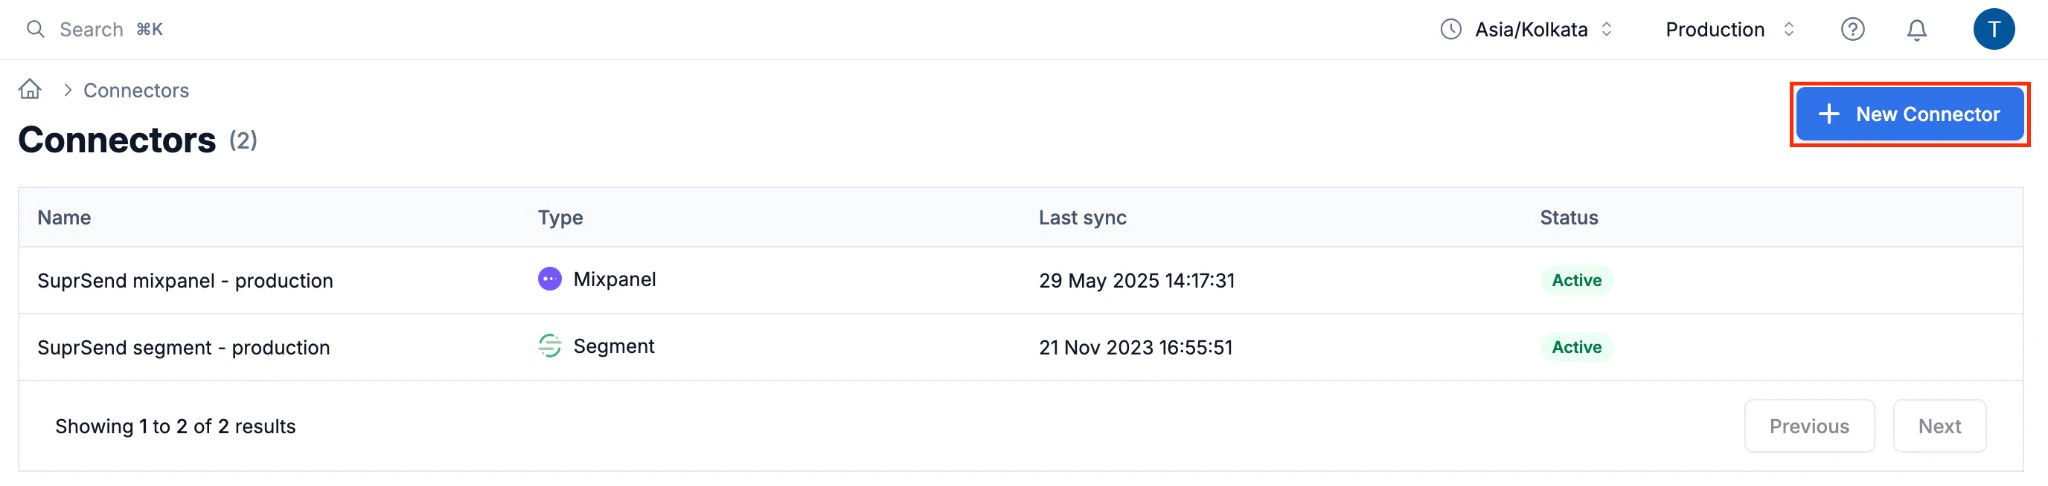 Fill in the following fields:
| Field | Description |
| ------------------ | ---------------------------------------------------------------------------------------------------------------------------------------------------------------------------------------------------------------------------------------------------------------------------------------------------------------------------------------------------------------------- |
| **Connector Name** | A label to identify this connector (for example `New Relic Production`) |
| **OTLP Endpoint** | Select your New Relic region from the dropdown |
| **API Key** | A New Relic **License** (ingest) key. Create one from the [API Keys](https://one.newrelic.com/launcher/api-keys-ui.api-keys-launcher) page — click **Create a key**, choose **Ingest - License** as the key type, and give it a name (for example `SuprSend`). We recommend creating a dedicated license key for SuprSend so you can rotate or revoke it independently |
| **Events to sync** | One or more metric events to export (see [Reported metrics](#reported-metrics)) |
| **Protocol** | `HTTP` or `gRPC`. Both are supported - choose the one your network allows. |
Click **Save**. Your metrics will start streaming to New Relic within a few minutes.
***
## Dashboard starter kit
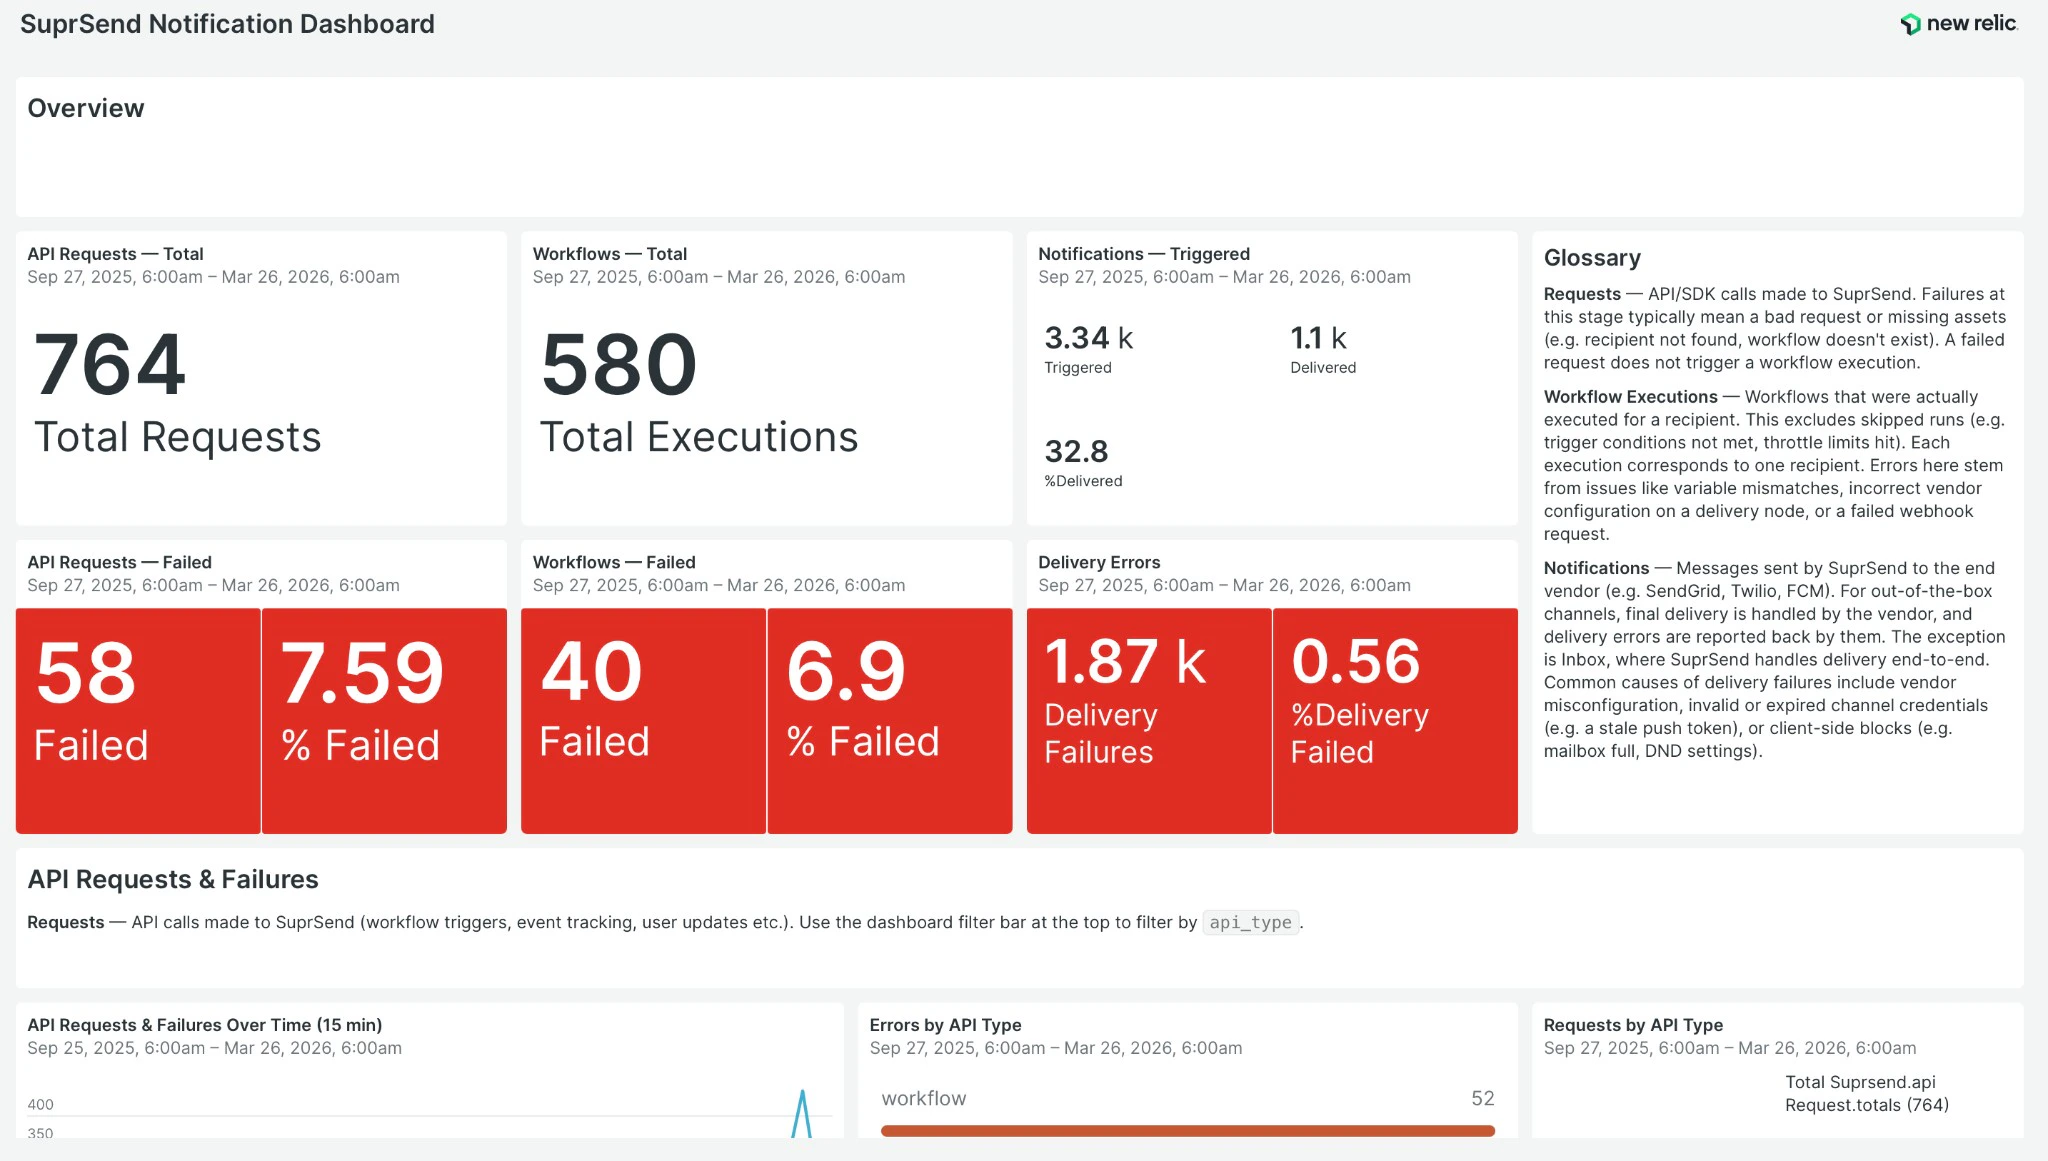
Get started quickly with our pre-built New Relic dashboard to visualize your SuprSend metrics in a few clicks.
Fill in the following fields:
| Field | Description |
| ------------------ | ---------------------------------------------------------------------------------------------------------------------------------------------------------------------------------------------------------------------------------------------------------------------------------------------------------------------------------------------------------------------- |
| **Connector Name** | A label to identify this connector (for example `New Relic Production`) |
| **OTLP Endpoint** | Select your New Relic region from the dropdown |
| **API Key** | A New Relic **License** (ingest) key. Create one from the [API Keys](https://one.newrelic.com/launcher/api-keys-ui.api-keys-launcher) page — click **Create a key**, choose **Ingest - License** as the key type, and give it a name (for example `SuprSend`). We recommend creating a dedicated license key for SuprSend so you can rotate or revoke it independently |
| **Events to sync** | One or more metric events to export (see [Reported metrics](#reported-metrics)) |
| **Protocol** | `HTTP` or `gRPC`. Both are supported - choose the one your network allows. |
Click **Save**. Your metrics will start streaming to New Relic within a few minutes.
***
## Dashboard starter kit
Get started quickly with our pre-built New Relic dashboard to visualize your SuprSend metrics in a few clicks.
 ```json Copy Dashboard Starter Kit JSON theme={"system"}
{"name":"SuprSend Notification Dashboard","description":null,"permissions":"PUBLIC_READ_WRITE","pages":[{"guid":"NDM3NTU0MXxWSVp8REFTSEJPQVJEfDQ3NDU5NjQw","name":"SuprSend Notification Dashboard","description":null,"widgets":[{"id":"527954736","title":"","layout":{"column":1,"row":1,"width":12,"height":1},"linkedEntityGuids":null,"visualization":{"id":"viz.markdown"},"rawConfiguration":{"text":"## Overview"}},{"id":"527954737","title":"API Requests — Total","layout":{"column":1,"row":2,"width":3,"height":2},"linkedEntityGuids":null,"visualization":{"id":"viz.billboard"},"rawConfiguration":{"nrqlQueries":[{"accountIds":[4375541],"query":"FROM Metric SELECT sum(suprsend.api_request.total) AS 'Total Requests' SINCE 1 day ago"}]}},{"id":"527954740","title":"Workflows — Total","layout":{"column":4,"row":2,"width":3,"height":2},"linkedEntityGuids":null,"visualization":{"id":"viz.billboard"},"rawConfiguration":{"nrqlQueries":[{"accountIds":[4375541],"query":"FROM Metric SELECT sum(suprsend.workflow_execution.total) AS 'Total Executions' SINCE 1 day ago"}]}},{"id":"527954743","title":"Notifications — Triggered","layout":{"column":7,"row":2,"width":3,"height":2},"linkedEntityGuids":null,"visualization":{"id":"viz.billboard"},"rawConfiguration":{"chartStyles":{"lineInterpolation":"linear"},"facet":{"showOtherSeries":false},"nrqlQueries":[{"accountIds":[4375541],"query":"FROM Metric SELECT sum(suprsend.messages.triggered) AS 'Triggered', sum(suprsend.messages.delivered) AS 'Delivered', sum(suprsend.messages.delivered)*100/sum(suprsend.messages.triggered) AS '%Delivered' SINCE 1 day ago"}],"platformOptions":{"ignoreTimeRange":false}}},{"id":"527958970","title":null,"layout":{"column":10,"row":2,"width":3,"height":4},"linkedEntityGuids":null,"visualization":{"id":"viz.markdown"},"rawConfiguration":{"text":"### Glossary \n \n**Requests** — API/SDK calls made to SuprSend. Failures at this stage typically mean a bad request or missing assets (for example recipient not found, workflow doesn't exist). A failed request does not trigger a workflow execution. \n\n**Workflow Executions** — Workflows that were actually executed for a recipient. This excludes skipped runs (for example trigger conditions not met, throttle limits hit). Each execution corresponds to one recipient. Errors here stem from issues like variable mismatches, incorrect vendor configuration on a delivery node, or a failed webhook request. \n\n**Notifications** — Messages sent by SuprSend to the end vendor (for example SendGrid, Twilio, FCM). For out-of-the-box channels, final delivery is handled by the vendor, and delivery errors are reported back by them. The exception is Inbox, where SuprSend handles delivery end-to-end. Common causes of delivery failures include vendor misconfiguration, invalid or expired channel credentials (for example a stale push token), or client-side blocks (for example mailbox full, DND settings)."}},{"id":"527954738","title":"API Requests — Failed","layout":{"column":1,"row":4,"width":3,"height":2},"linkedEntityGuids":null,"visualization":{"id":"viz.billboard"},"rawConfiguration":{"chartStyles":{"lineInterpolation":"linear"},"facet":{"showOtherSeries":false},"nrqlQueries":[{"accountIds":[4375541],"query":"FROM Metric SELECT sum(suprsend.api_request.errors) AS 'Failed', sum(suprsend.api_request.errors)*100/sum(suprsend.api_request.total) AS '% Failed' SINCE 1 day ago"}],"platformOptions":{"ignoreTimeRange":false},"thresholdsWithSeriesOverrides":{"thresholds":[{"severity":"success","to":0},{"from":0,"severity":"critical"}]}}},{"id":"527954741","title":"Workflows — Failed","layout":{"column":4,"row":4,"width":3,"height":2},"linkedEntityGuids":null,"visualization":{"id":"viz.billboard"},"rawConfiguration":{"chartStyles":{"lineInterpolation":"linear"},"facet":{"showOtherSeries":false},"nrqlQueries":[{"accountIds":[4375541],"query":"FROM Metric SELECT sum(suprsend.workflow_execution.errors) + sum(suprsend.Broadcast_execution.errors) AS 'Failed', (sum(suprsend.workflow_execution.errors) + sum(suprsend.Broadcast_execution.errors))*100/sum(suprsend.workflow_execution.total) as '% Failed' SINCE 1 day ago"}],"platformOptions":{"ignoreTimeRange":false},"thresholdsWithSeriesOverrides":{"thresholds":[{"severity":"success","to":0.9},{"from":0.9,"severity":"critical"}]}}},{"id":"527954745","title":"Delivery Errors","layout":{"column":7,"row":4,"width":3,"height":2},"linkedEntityGuids":null,"visualization":{"id":"viz.billboard"},"rawConfiguration":{"chartStyles":{"lineInterpolation":"linear"},"dataFormatters":[],"facet":{"showOtherSeries":false},"nrqlQueries":[{"accountIds":[4375541],"query":"FROM Metric SELECT sum(suprsend.messages.delivery_errors) AS 'Delivery Failures', sum(suprsend.messages.delivery_errors)/sum(suprsend.messages.triggered) AS '%Delivery Failed' SINCE 1 day ago"}],"platformOptions":{"ignoreTimeRange":false},"thresholdsWithSeriesOverrides":{"thresholds":[{"severity":"success","to":0},{"from":0,"severity":"critical"}]}}},{"id":"527954747","title":"","layout":{"column":1,"row":6,"width":12,"height":1},"linkedEntityGuids":null,"visualization":{"id":"viz.markdown"},"rawConfiguration":{"text":"## API Requests & Failures\n**Requests** — API calls made to SuprSend (workflow triggers, event tracking, user updates etc.). Use the dashboard filter bar at the top to filter by `api_type`."}},{"id":"527954748","title":"API Requests & Failures Over Time (15 min)","layout":{"column":1,"row":7,"width":5,"height":3},"linkedEntityGuids":null,"visualization":{"id":"viz.line"},"rawConfiguration":{"chartStyles":{"lineInterpolation":"linear"},"colors":{"seriesOverrides":[{"color":"#af1212","seriesName":"Failed Requests"},{"color":"#1da6c9","seriesName":"Total Requests"}]},"facet":{"showOtherSeries":false},"legend":{"enabled":true},"markers":{"displayedTypes":{"annotations":true,"criticalViolations":false,"deployments":true,"relatedDeployments":true,"warningViolations":false}},"nrqlQueries":[{"accountIds":[4375541],"query":"FROM Metric SELECT sum(suprsend.api_request.total) AS 'Total Requests', sum(suprsend.api_request.errors) AS 'Failed Requests' SINCE today TIMESERIES 15 minutes"}],"platformOptions":{"ignoreTimeRange":false},"thresholds":{"isLabelVisible":true},"yAxisLeft":{"zero":true},"yAxisRight":{"zero":true}}},{"id":"527954749","title":"Errors by API Type","layout":{"column":6,"row":7,"width":4,"height":3},"linkedEntityGuids":null,"visualization":{"id":"viz.bar"},"rawConfiguration":{"nrqlQueries":[{"accountIds":[4375541],"query":"FROM Metric SELECT sum(suprsend.api_request.errors) AS 'Error Count' FACET api_type SINCE 1 day ago LIMIT 10"}]}},{"id":"527954750","title":"Requests by API Type","layout":{"column":10,"row":7,"width":3,"height":3},"linkedEntityGuids":null,"visualization":{"id":"viz.pie"},"rawConfiguration":{"nrqlQueries":[{"accountIds":[4375541],"query":"FROM Metric SELECT sum(suprsend.api_request.total) FACET api_type SINCE 1 day ago"}]}},{"id":"527954751","title":"","layout":{"column":1,"row":10,"width":12,"height":1},"linkedEntityGuids":null,"visualization":{"id":"viz.markdown"},"rawConfiguration":{"text":"## Workflow Executions & Failures\n**Executions** — Workflow and broadcast runs that process notification logic (routing, templates, channel selection). Use the dashboard filter bar to filter by `workflow_slug` or `category`."}},{"id":"527954752","title":"Workflow Executions & Errors Over Time (15 min)","layout":{"column":1,"row":11,"width":5,"height":3},"linkedEntityGuids":null,"visualization":{"id":"viz.line"},"rawConfiguration":{"chartStyles":{"lineInterpolation":"linear"},"colors":{"seriesOverrides":[{"color":"#af1212","seriesName":"Workflow Errors"},{"color":"#770909","seriesName":"Broadcast Errors"}]},"facet":{"showOtherSeries":false},"legend":{"enabled":true},"markers":{"displayedTypes":{"annotations":true,"criticalViolations":false,"deployments":true,"relatedDeployments":true,"warningViolations":false}},"nrqlQueries":[{"accountIds":[4375541],"query":"FROM Metric SELECT sum(suprsend.workflow_execution.total) AS 'Total Executions', sum(suprsend.workflow_execution.errors) AS 'Workflow Errors', sum(suprsend.Broadcast_execution.errors) AS 'Broadcast Errors' SINCE today TIMESERIES 15 minutes"}],"platformOptions":{"ignoreTimeRange":false},"thresholds":{"isLabelVisible":true},"yAxisLeft":{"zero":true},"yAxisRight":{"zero":true}}},{"id":"527954753","title":"Top Failing Workflows","layout":{"column":6,"row":11,"width":4,"height":3},"linkedEntityGuids":null,"visualization":{"id":"viz.bar"},"rawConfiguration":{"facet":{"showOtherSeries":false},"nrqlQueries":[{"accountIds":[4375541],"query":"FROM Metric SELECT sum(suprsend.workflow_execution.errors) AS 'Errors' FACET workflow_slug SINCE 1 day ago LIMIT 100"}],"platformOptions":{"ignoreTimeRange":false}}},{"id":"527954754","title":"Executions by Workflow","layout":{"column":10,"row":11,"width":3,"height":3},"linkedEntityGuids":null,"visualization":{"id":"viz.pie"},"rawConfiguration":{"chartStyles":{"gradient":{"enabled":false}},"facet":{"showOtherSeries":true},"legend":{"enabled":true},"nrqlQueries":[{"accountIds":[4375541],"query":"FROM Metric SELECT sum(suprsend.workflow_execution.total) FACET workflow_slug SINCE 1 day ago"}],"platformOptions":{"ignoreTimeRange":false}}},{"id":"527954757","title":"","layout":{"column":1,"row":14,"width":12,"height":1},"linkedEntityGuids":null,"visualization":{"id":"viz.markdown"},"rawConfiguration":{"text":"## Notification Delivery & Engagement\n**Delivery** — Actual notifications sent to end-users via channels (email, SMS, push, WhatsApp, etc.). Use the dashboard filter bar to filter by `channel` or `vendor`."}},{"id":"527954758","title":"Delivery & Engagement Summary","layout":{"column":1,"row":15,"width":12,"height":3},"linkedEntityGuids":null,"visualization":{"id":"viz.billboard"},"rawConfiguration":{"nrqlQueries":[{"accountIds":[4375541],"query":"FROM Metric SELECT sum(suprsend.messages.triggered) AS 'Triggered', sum(suprsend.messages.delivered) AS 'Delivered', sum(suprsend.messages.delivery_errors) AS 'Delivery Failures', sum(suprsend.messages.seen) AS 'Seen', sum(suprsend.messages.clicked) AS 'Clicked', sum(suprsend.messages.delivered) / sum(suprsend.messages.triggered) * 100 AS '% Delivered', sum(suprsend.messages.delivery_errors)/ sum(suprsend.messages.triggered) *100 AS '% Failed Delivery', sum(suprsend.messages.seen) / sum(suprsend.messages.delivered) * 100 AS '% Seen / Delivered', sum(suprsend.messages.clicked) / sum(suprsend.messages.delivered) * 100 AS '% Clicked / Delivered' SINCE 1 day ago"}]}},{"id":"527954759","title":"Delivered & Delivery Errors Over Time (15 min)","layout":{"column":1,"row":18,"width":6,"height":3},"linkedEntityGuids":null,"visualization":{"id":"viz.line"},"rawConfiguration":{"chartStyles":{"lineInterpolation":"linear"},"colors":{"seriesOverrides":[{"color":"#c93131","seriesName":"Delivery Errors"}]},"facet":{"showOtherSeries":false},"legend":{"enabled":true},"markers":{"displayedTypes":{"annotations":true,"criticalViolations":false,"deployments":true,"relatedDeployments":true,"warningViolations":false}},"nrqlQueries":[{"accountIds":[4375541],"query":"FROM Metric SELECT sum(suprsend.messages.triggered) AS 'Triggered', sum(suprsend.messages.delivered) AS 'Delivered', sum(suprsend.messages.delivery_errors) AS 'Delivery Errors' SINCE today TIMESERIES 15 minutes"}],"platformOptions":{"ignoreTimeRange":false},"thresholds":{"isLabelVisible":true},"yAxisLeft":{"zero":true},"yAxisRight":{"zero":true}}},{"id":"527954760","title":"Seen & Clicked Over Time (15 min)","layout":{"column":7,"row":18,"width":6,"height":3},"linkedEntityGuids":null,"visualization":{"id":"viz.line"},"rawConfiguration":{"nrqlQueries":[{"accountIds":[4375541],"query":"FROM Metric SELECT sum(suprsend.messages.seen) AS 'Seen', sum(suprsend.messages.clicked) AS 'Clicked' SINCE today TIMESERIES 15 minutes"}]}},{"id":"527954761","title":"Delivery & Engagement — Workflow Level Breakdown","layout":{"column":1,"row":21,"width":12,"height":5},"linkedEntityGuids":null,"visualization":{"id":"viz.table"},"rawConfiguration":{"facet":{"showOtherSeries":false},"nrqlQueries":[{"accountIds":[4375541],"query":"FROM Metric SELECT sum(suprsend.messages.triggered) AS 'Triggered', sum(suprsend.messages.delivered) / sum(suprsend.messages.triggered) * 100 AS '% Delivered', sum(suprsend.messages.seen) / sum(suprsend.messages.delivered) * 100 AS '% Seen / Delivered', sum(suprsend.messages.clicked) / sum(suprsend.messages.delivered) * 100 AS '% Clicked / Delivered' FACET workflow_slug, category, channel, vendor SINCE 1 day ago LIMIT 100"}],"platformOptions":{"ignoreTimeRange":false}}}]}],"variables":[]}
```
To import, navigate to **Dashboards** in New Relic, click **Import dashboard**, and paste the JSON above. Use the copy button to copy the JSON.
***
## Setting up alerts
Once your metrics are flowing into New Relic, you can create alert conditions to get notified when something goes wrong in your notification pipeline. Here are two examples to get you started.
### Example 1 - Alert on delivery error rate spike
Alert when message delivery errors exceed a threshold - useful for catching vendor-side failures or misconfigurations before users notice.
1. In New Relic, go to [**Alerts**](https://one.newrelic.com/alerts) and click **Create alert condition**.
2. Choose **Write your own query** to define your alert using [NRQL](https://docs.newrelic.com/docs/nrql/get-started/introduction-nrql-new-relics-query-language/), or use **Guided mode** if you prefer a step-by-step builder.
3. If using **Write your own query**, enter the following NRQL query:
```sql theme={"system"}
SELECT sum(suprsend.messages.delivery_errors) FROM Metric SINCE 5 minutes ago
```
4. Click **Next** to proceed to **Set condition thresholds**.
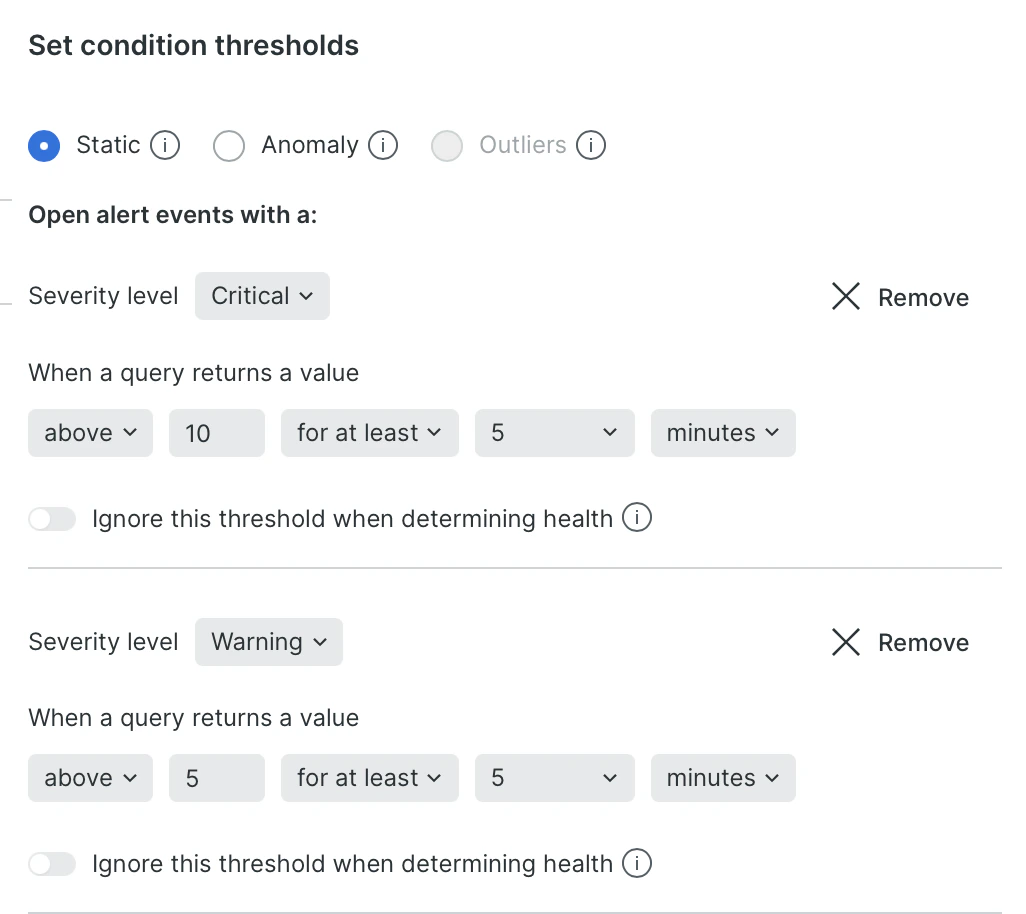
5. Set the threshold type to [**Static**](https://docs.newrelic.com/docs/alerts/create-alert/set-thresholds/set-thresholds/) - this triggers the alert when the query returns a value above a fixed number.
6. Set the thresholds:
* **Critical**: `above 10` for at least `5 minutes`
* **Warning**: `above 5` for at least `5 minutes`
Tune these values based on your normal delivery volume.
```json Copy Dashboard Starter Kit JSON theme={"system"}
{"name":"SuprSend Notification Dashboard","description":null,"permissions":"PUBLIC_READ_WRITE","pages":[{"guid":"NDM3NTU0MXxWSVp8REFTSEJPQVJEfDQ3NDU5NjQw","name":"SuprSend Notification Dashboard","description":null,"widgets":[{"id":"527954736","title":"","layout":{"column":1,"row":1,"width":12,"height":1},"linkedEntityGuids":null,"visualization":{"id":"viz.markdown"},"rawConfiguration":{"text":"## Overview"}},{"id":"527954737","title":"API Requests — Total","layout":{"column":1,"row":2,"width":3,"height":2},"linkedEntityGuids":null,"visualization":{"id":"viz.billboard"},"rawConfiguration":{"nrqlQueries":[{"accountIds":[4375541],"query":"FROM Metric SELECT sum(suprsend.api_request.total) AS 'Total Requests' SINCE 1 day ago"}]}},{"id":"527954740","title":"Workflows — Total","layout":{"column":4,"row":2,"width":3,"height":2},"linkedEntityGuids":null,"visualization":{"id":"viz.billboard"},"rawConfiguration":{"nrqlQueries":[{"accountIds":[4375541],"query":"FROM Metric SELECT sum(suprsend.workflow_execution.total) AS 'Total Executions' SINCE 1 day ago"}]}},{"id":"527954743","title":"Notifications — Triggered","layout":{"column":7,"row":2,"width":3,"height":2},"linkedEntityGuids":null,"visualization":{"id":"viz.billboard"},"rawConfiguration":{"chartStyles":{"lineInterpolation":"linear"},"facet":{"showOtherSeries":false},"nrqlQueries":[{"accountIds":[4375541],"query":"FROM Metric SELECT sum(suprsend.messages.triggered) AS 'Triggered', sum(suprsend.messages.delivered) AS 'Delivered', sum(suprsend.messages.delivered)*100/sum(suprsend.messages.triggered) AS '%Delivered' SINCE 1 day ago"}],"platformOptions":{"ignoreTimeRange":false}}},{"id":"527958970","title":null,"layout":{"column":10,"row":2,"width":3,"height":4},"linkedEntityGuids":null,"visualization":{"id":"viz.markdown"},"rawConfiguration":{"text":"### Glossary \n \n**Requests** — API/SDK calls made to SuprSend. Failures at this stage typically mean a bad request or missing assets (for example recipient not found, workflow doesn't exist). A failed request does not trigger a workflow execution. \n\n**Workflow Executions** — Workflows that were actually executed for a recipient. This excludes skipped runs (for example trigger conditions not met, throttle limits hit). Each execution corresponds to one recipient. Errors here stem from issues like variable mismatches, incorrect vendor configuration on a delivery node, or a failed webhook request. \n\n**Notifications** — Messages sent by SuprSend to the end vendor (for example SendGrid, Twilio, FCM). For out-of-the-box channels, final delivery is handled by the vendor, and delivery errors are reported back by them. The exception is Inbox, where SuprSend handles delivery end-to-end. Common causes of delivery failures include vendor misconfiguration, invalid or expired channel credentials (for example a stale push token), or client-side blocks (for example mailbox full, DND settings)."}},{"id":"527954738","title":"API Requests — Failed","layout":{"column":1,"row":4,"width":3,"height":2},"linkedEntityGuids":null,"visualization":{"id":"viz.billboard"},"rawConfiguration":{"chartStyles":{"lineInterpolation":"linear"},"facet":{"showOtherSeries":false},"nrqlQueries":[{"accountIds":[4375541],"query":"FROM Metric SELECT sum(suprsend.api_request.errors) AS 'Failed', sum(suprsend.api_request.errors)*100/sum(suprsend.api_request.total) AS '% Failed' SINCE 1 day ago"}],"platformOptions":{"ignoreTimeRange":false},"thresholdsWithSeriesOverrides":{"thresholds":[{"severity":"success","to":0},{"from":0,"severity":"critical"}]}}},{"id":"527954741","title":"Workflows — Failed","layout":{"column":4,"row":4,"width":3,"height":2},"linkedEntityGuids":null,"visualization":{"id":"viz.billboard"},"rawConfiguration":{"chartStyles":{"lineInterpolation":"linear"},"facet":{"showOtherSeries":false},"nrqlQueries":[{"accountIds":[4375541],"query":"FROM Metric SELECT sum(suprsend.workflow_execution.errors) + sum(suprsend.Broadcast_execution.errors) AS 'Failed', (sum(suprsend.workflow_execution.errors) + sum(suprsend.Broadcast_execution.errors))*100/sum(suprsend.workflow_execution.total) as '% Failed' SINCE 1 day ago"}],"platformOptions":{"ignoreTimeRange":false},"thresholdsWithSeriesOverrides":{"thresholds":[{"severity":"success","to":0.9},{"from":0.9,"severity":"critical"}]}}},{"id":"527954745","title":"Delivery Errors","layout":{"column":7,"row":4,"width":3,"height":2},"linkedEntityGuids":null,"visualization":{"id":"viz.billboard"},"rawConfiguration":{"chartStyles":{"lineInterpolation":"linear"},"dataFormatters":[],"facet":{"showOtherSeries":false},"nrqlQueries":[{"accountIds":[4375541],"query":"FROM Metric SELECT sum(suprsend.messages.delivery_errors) AS 'Delivery Failures', sum(suprsend.messages.delivery_errors)/sum(suprsend.messages.triggered) AS '%Delivery Failed' SINCE 1 day ago"}],"platformOptions":{"ignoreTimeRange":false},"thresholdsWithSeriesOverrides":{"thresholds":[{"severity":"success","to":0},{"from":0,"severity":"critical"}]}}},{"id":"527954747","title":"","layout":{"column":1,"row":6,"width":12,"height":1},"linkedEntityGuids":null,"visualization":{"id":"viz.markdown"},"rawConfiguration":{"text":"## API Requests & Failures\n**Requests** — API calls made to SuprSend (workflow triggers, event tracking, user updates etc.). Use the dashboard filter bar at the top to filter by `api_type`."}},{"id":"527954748","title":"API Requests & Failures Over Time (15 min)","layout":{"column":1,"row":7,"width":5,"height":3},"linkedEntityGuids":null,"visualization":{"id":"viz.line"},"rawConfiguration":{"chartStyles":{"lineInterpolation":"linear"},"colors":{"seriesOverrides":[{"color":"#af1212","seriesName":"Failed Requests"},{"color":"#1da6c9","seriesName":"Total Requests"}]},"facet":{"showOtherSeries":false},"legend":{"enabled":true},"markers":{"displayedTypes":{"annotations":true,"criticalViolations":false,"deployments":true,"relatedDeployments":true,"warningViolations":false}},"nrqlQueries":[{"accountIds":[4375541],"query":"FROM Metric SELECT sum(suprsend.api_request.total) AS 'Total Requests', sum(suprsend.api_request.errors) AS 'Failed Requests' SINCE today TIMESERIES 15 minutes"}],"platformOptions":{"ignoreTimeRange":false},"thresholds":{"isLabelVisible":true},"yAxisLeft":{"zero":true},"yAxisRight":{"zero":true}}},{"id":"527954749","title":"Errors by API Type","layout":{"column":6,"row":7,"width":4,"height":3},"linkedEntityGuids":null,"visualization":{"id":"viz.bar"},"rawConfiguration":{"nrqlQueries":[{"accountIds":[4375541],"query":"FROM Metric SELECT sum(suprsend.api_request.errors) AS 'Error Count' FACET api_type SINCE 1 day ago LIMIT 10"}]}},{"id":"527954750","title":"Requests by API Type","layout":{"column":10,"row":7,"width":3,"height":3},"linkedEntityGuids":null,"visualization":{"id":"viz.pie"},"rawConfiguration":{"nrqlQueries":[{"accountIds":[4375541],"query":"FROM Metric SELECT sum(suprsend.api_request.total) FACET api_type SINCE 1 day ago"}]}},{"id":"527954751","title":"","layout":{"column":1,"row":10,"width":12,"height":1},"linkedEntityGuids":null,"visualization":{"id":"viz.markdown"},"rawConfiguration":{"text":"## Workflow Executions & Failures\n**Executions** — Workflow and broadcast runs that process notification logic (routing, templates, channel selection). Use the dashboard filter bar to filter by `workflow_slug` or `category`."}},{"id":"527954752","title":"Workflow Executions & Errors Over Time (15 min)","layout":{"column":1,"row":11,"width":5,"height":3},"linkedEntityGuids":null,"visualization":{"id":"viz.line"},"rawConfiguration":{"chartStyles":{"lineInterpolation":"linear"},"colors":{"seriesOverrides":[{"color":"#af1212","seriesName":"Workflow Errors"},{"color":"#770909","seriesName":"Broadcast Errors"}]},"facet":{"showOtherSeries":false},"legend":{"enabled":true},"markers":{"displayedTypes":{"annotations":true,"criticalViolations":false,"deployments":true,"relatedDeployments":true,"warningViolations":false}},"nrqlQueries":[{"accountIds":[4375541],"query":"FROM Metric SELECT sum(suprsend.workflow_execution.total) AS 'Total Executions', sum(suprsend.workflow_execution.errors) AS 'Workflow Errors', sum(suprsend.Broadcast_execution.errors) AS 'Broadcast Errors' SINCE today TIMESERIES 15 minutes"}],"platformOptions":{"ignoreTimeRange":false},"thresholds":{"isLabelVisible":true},"yAxisLeft":{"zero":true},"yAxisRight":{"zero":true}}},{"id":"527954753","title":"Top Failing Workflows","layout":{"column":6,"row":11,"width":4,"height":3},"linkedEntityGuids":null,"visualization":{"id":"viz.bar"},"rawConfiguration":{"facet":{"showOtherSeries":false},"nrqlQueries":[{"accountIds":[4375541],"query":"FROM Metric SELECT sum(suprsend.workflow_execution.errors) AS 'Errors' FACET workflow_slug SINCE 1 day ago LIMIT 100"}],"platformOptions":{"ignoreTimeRange":false}}},{"id":"527954754","title":"Executions by Workflow","layout":{"column":10,"row":11,"width":3,"height":3},"linkedEntityGuids":null,"visualization":{"id":"viz.pie"},"rawConfiguration":{"chartStyles":{"gradient":{"enabled":false}},"facet":{"showOtherSeries":true},"legend":{"enabled":true},"nrqlQueries":[{"accountIds":[4375541],"query":"FROM Metric SELECT sum(suprsend.workflow_execution.total) FACET workflow_slug SINCE 1 day ago"}],"platformOptions":{"ignoreTimeRange":false}}},{"id":"527954757","title":"","layout":{"column":1,"row":14,"width":12,"height":1},"linkedEntityGuids":null,"visualization":{"id":"viz.markdown"},"rawConfiguration":{"text":"## Notification Delivery & Engagement\n**Delivery** — Actual notifications sent to end-users via channels (email, SMS, push, WhatsApp, etc.). Use the dashboard filter bar to filter by `channel` or `vendor`."}},{"id":"527954758","title":"Delivery & Engagement Summary","layout":{"column":1,"row":15,"width":12,"height":3},"linkedEntityGuids":null,"visualization":{"id":"viz.billboard"},"rawConfiguration":{"nrqlQueries":[{"accountIds":[4375541],"query":"FROM Metric SELECT sum(suprsend.messages.triggered) AS 'Triggered', sum(suprsend.messages.delivered) AS 'Delivered', sum(suprsend.messages.delivery_errors) AS 'Delivery Failures', sum(suprsend.messages.seen) AS 'Seen', sum(suprsend.messages.clicked) AS 'Clicked', sum(suprsend.messages.delivered) / sum(suprsend.messages.triggered) * 100 AS '% Delivered', sum(suprsend.messages.delivery_errors)/ sum(suprsend.messages.triggered) *100 AS '% Failed Delivery', sum(suprsend.messages.seen) / sum(suprsend.messages.delivered) * 100 AS '% Seen / Delivered', sum(suprsend.messages.clicked) / sum(suprsend.messages.delivered) * 100 AS '% Clicked / Delivered' SINCE 1 day ago"}]}},{"id":"527954759","title":"Delivered & Delivery Errors Over Time (15 min)","layout":{"column":1,"row":18,"width":6,"height":3},"linkedEntityGuids":null,"visualization":{"id":"viz.line"},"rawConfiguration":{"chartStyles":{"lineInterpolation":"linear"},"colors":{"seriesOverrides":[{"color":"#c93131","seriesName":"Delivery Errors"}]},"facet":{"showOtherSeries":false},"legend":{"enabled":true},"markers":{"displayedTypes":{"annotations":true,"criticalViolations":false,"deployments":true,"relatedDeployments":true,"warningViolations":false}},"nrqlQueries":[{"accountIds":[4375541],"query":"FROM Metric SELECT sum(suprsend.messages.triggered) AS 'Triggered', sum(suprsend.messages.delivered) AS 'Delivered', sum(suprsend.messages.delivery_errors) AS 'Delivery Errors' SINCE today TIMESERIES 15 minutes"}],"platformOptions":{"ignoreTimeRange":false},"thresholds":{"isLabelVisible":true},"yAxisLeft":{"zero":true},"yAxisRight":{"zero":true}}},{"id":"527954760","title":"Seen & Clicked Over Time (15 min)","layout":{"column":7,"row":18,"width":6,"height":3},"linkedEntityGuids":null,"visualization":{"id":"viz.line"},"rawConfiguration":{"nrqlQueries":[{"accountIds":[4375541],"query":"FROM Metric SELECT sum(suprsend.messages.seen) AS 'Seen', sum(suprsend.messages.clicked) AS 'Clicked' SINCE today TIMESERIES 15 minutes"}]}},{"id":"527954761","title":"Delivery & Engagement — Workflow Level Breakdown","layout":{"column":1,"row":21,"width":12,"height":5},"linkedEntityGuids":null,"visualization":{"id":"viz.table"},"rawConfiguration":{"facet":{"showOtherSeries":false},"nrqlQueries":[{"accountIds":[4375541],"query":"FROM Metric SELECT sum(suprsend.messages.triggered) AS 'Triggered', sum(suprsend.messages.delivered) / sum(suprsend.messages.triggered) * 100 AS '% Delivered', sum(suprsend.messages.seen) / sum(suprsend.messages.delivered) * 100 AS '% Seen / Delivered', sum(suprsend.messages.clicked) / sum(suprsend.messages.delivered) * 100 AS '% Clicked / Delivered' FACET workflow_slug, category, channel, vendor SINCE 1 day ago LIMIT 100"}],"platformOptions":{"ignoreTimeRange":false}}}]}],"variables":[]}
```
To import, navigate to **Dashboards** in New Relic, click **Import dashboard**, and paste the JSON above. Use the copy button to copy the JSON.
***
## Setting up alerts
Once your metrics are flowing into New Relic, you can create alert conditions to get notified when something goes wrong in your notification pipeline. Here are two examples to get you started.
### Example 1 - Alert on delivery error rate spike
Alert when message delivery errors exceed a threshold - useful for catching vendor-side failures or misconfigurations before users notice.
1. In New Relic, go to [**Alerts**](https://one.newrelic.com/alerts) and click **Create alert condition**.
2. Choose **Write your own query** to define your alert using [NRQL](https://docs.newrelic.com/docs/nrql/get-started/introduction-nrql-new-relics-query-language/), or use **Guided mode** if you prefer a step-by-step builder.
3. If using **Write your own query**, enter the following NRQL query:
```sql theme={"system"}
SELECT sum(suprsend.messages.delivery_errors) FROM Metric SINCE 5 minutes ago
```
4. Click **Next** to proceed to **Set condition thresholds**.
5. Set the threshold type to [**Static**](https://docs.newrelic.com/docs/alerts/create-alert/set-thresholds/set-thresholds/) - this triggers the alert when the query returns a value above a fixed number.
6. Set the thresholds:
* **Critical**: `above 10` for at least `5 minutes`
* **Warning**: `above 5` for at least `5 minutes`
Tune these values based on your normal delivery volume.
 7. Name the condition (for example `SuprSend — Delivery Error Spike`) and attach it to an [alert policy](https://docs.newrelic.com/docs/alerts/organize-alerts/create-edit-or-find-alert-policy/).
8. Click **Save condition**.
### Example 2 - Alert on anomalous message delivery drop
Alert when delivered message volume drops unexpectedly - useful for catching silent failures where messages stop flowing without a corresponding error.
1. In New Relic, go to [**Alerts**](https://one.newrelic.com/alerts) **→ Alert Conditions** and click **+ New alert condition**.
2. Choose **Write your own query** to define your alert using [NRQL](https://docs.newrelic.com/docs/nrql/get-started/introduction-nrql-new-relics-query-language/), or use **Guided mode** if you prefer a step-by-step builder.
3. If using **Write your own query**, enter the following NRQL query:
```sql theme={"system"}
SELECT sum(suprsend.messages.delivered) FROM Metric SINCE 15 minutes ago
```
4. Click **Next** to proceed to **Set condition thresholds**.
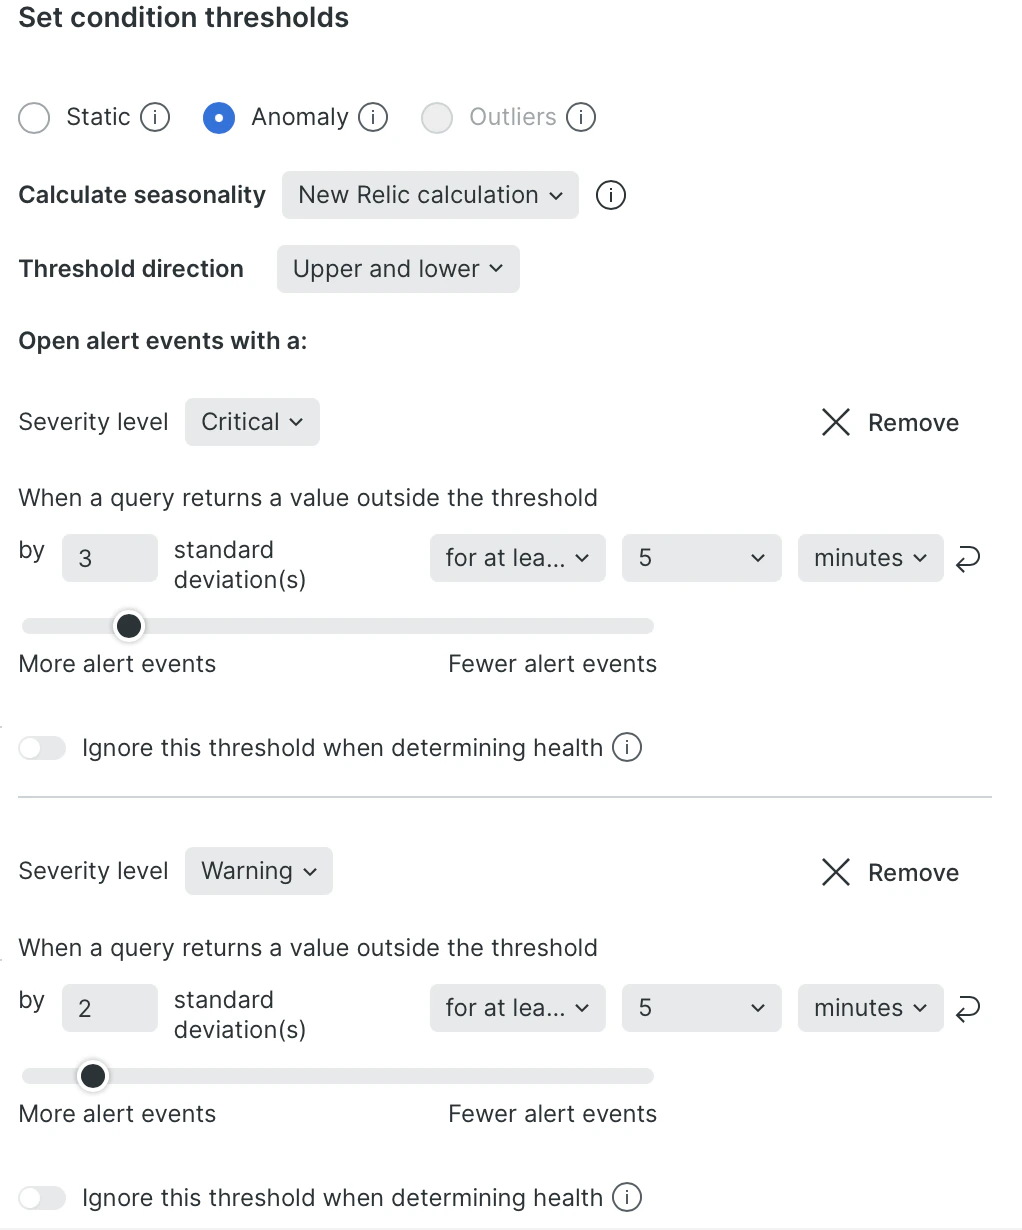
5. Set the threshold type to [**Anomaly**](https://docs.newrelic.com/docs/alerts/create-alert/set-thresholds/anomaly-detection/) - this triggers the alert when the query value deviates from its expected baseline.
6. Set the **Threshold direction** to **Lower only** (alert only when delivery drops below the expected range).
7. Set the **Critical** threshold to **3 standard deviations** and the **Warning** threshold to **2 standard deviations**.
7. Name the condition (for example `SuprSend — Delivery Error Spike`) and attach it to an [alert policy](https://docs.newrelic.com/docs/alerts/organize-alerts/create-edit-or-find-alert-policy/).
8. Click **Save condition**.
### Example 2 - Alert on anomalous message delivery drop
Alert when delivered message volume drops unexpectedly - useful for catching silent failures where messages stop flowing without a corresponding error.
1. In New Relic, go to [**Alerts**](https://one.newrelic.com/alerts) **→ Alert Conditions** and click **+ New alert condition**.
2. Choose **Write your own query** to define your alert using [NRQL](https://docs.newrelic.com/docs/nrql/get-started/introduction-nrql-new-relics-query-language/), or use **Guided mode** if you prefer a step-by-step builder.
3. If using **Write your own query**, enter the following NRQL query:
```sql theme={"system"}
SELECT sum(suprsend.messages.delivered) FROM Metric SINCE 15 minutes ago
```
4. Click **Next** to proceed to **Set condition thresholds**.
5. Set the threshold type to [**Anomaly**](https://docs.newrelic.com/docs/alerts/create-alert/set-thresholds/anomaly-detection/) - this triggers the alert when the query value deviates from its expected baseline.
6. Set the **Threshold direction** to **Lower only** (alert only when delivery drops below the expected range).
7. Set the **Critical** threshold to **3 standard deviations** and the **Warning** threshold to **2 standard deviations**.
 8. Name the condition (for example `SuprSend — Delivery Drop Anomaly`) and attach it to an [alert policy](https://docs.newrelic.com/docs/alerts/organize-alerts/create-edit-or-find-alert-policy/).
9. Click **Save condition**.
To route alert notifications to Slack, email, or PagerDuty, set up a **Workflow** in New Relic under **Alerts → Workflows** and connect it to your alert policy. See [New Relic's workflow docs](https://docs.newrelic.com/docs/alerts/get-notified/intro-notifications/) for details.
***
## Reported metrics
SuprSend streams the following `suprsend.*` counter metrics to New Relic. All counters are monotonically increasing and represent cumulative counts from the time the connector is enabled.
### API Requests
Track the volume and health of every API call made to SuprSend.
| Metric | Description |
| ----------------------------- | -------------------------------------------------------------------------------------------------------------------------------------------------------------------- |
| `suprsend.api_request.total` | Total number of API requests received by SuprSend. Use the `status` tag to break down by outcome - `sent`, `in_progress`, `success`, `failed`, or `partial_failure`. |
| `suprsend.api_request.errors` | API requests that failed to process due to an error. Group by `api_type` to identify which endpoint is failing, and by `error_severity` to prioritize investigation. |
**Tags on API Request metrics**
| Tag | Description |
| ---------------- | --------------------------------------------------- |
| `api_type` | The SuprSend API endpoint that was called |
| `method` | HTTP method of the request |
| `status` | Outcome of the request |
| `ws_uid` | Identifier of the SuprSend workspace (environment) |
| `ws_slug` | Slug of the SuprSend workspace. Eg. `staging` |
| `tenant_id` | Tenant ID if the request is scoped to a tenant |
| `error_severity` | Severity level of the error (on error metrics only) |
### Workflow Executions
Monitor how your workflows and broadcasts are performing and quickly spot execution failures.
| Metric | Description |
| ------------------------------------- | -------------------------------------------------------------------------------------------------------------------------------------------------------------------------- |
| `suprsend.workflow_execution.total` | Total number of workflow executions started. Workflow executions are counted per-recipient. Use `workflow_slug` and `category` tags to drill down into specific workflows. |
| `suprsend.workflow_execution.errors` | Workflow executions that failed to process due to an error. |
| `suprsend.broadcast_execution.errors` | Broadcast executions that failed to process due to an error. |
**Tags on Workflow Execution metrics**
| Tag | Description | Example values |
| ---------------- | --------------------------------------------------- | ------------------------------------ |
| `workflow_slug` | Slug of the workflow that was executed | `welcome-flow`, `order-confirmation` |
| `category` | Preference category of the workflow | `transactional`, `promotional` |
| `ws_slug` | Slug of the SuprSend workspace | `my-workspace` |
| `ws_uid` | Identifier of the SuprSend workspace (environment) | `your_ws_uid` |
| `tenant_id` | Tenant ID if the workflow is scoped to a tenant | `tenant_abc` |
| `error_severity` | Severity level of the error (on error metrics only) | `critical`, `warning`, `info` |
### Messages
Follow the full lifecycle of every message - from trigger through delivery, open, and click - and monitor delivery failures by vendor and channel.
| Metric | Description |
| ----------------------------------- | ----------------------------------------------------------------------------------------------------------------------- |
| `suprsend.messages.triggered` | Total number of messages triggered. Slice by `channel` and `vendor` to see volume distribution. |
| `suprsend.messages.delivered` | Total number of messages delivered to the recipient. |
| `suprsend.messages.delivery_errors` | Messages that failed to deliver due to an error. Use `vendor` / `channel` tags to isolate the error source. |
| `suprsend.messages.seen` | Total number of messages seen by the recipient. Requires vendor webhook callbacks to be configured (see note below). |
| `suprsend.messages.clicked` | Total number of messages clicked by the recipient. Requires vendor webhook callbacks to be configured (see note below). |
**Tags on Message metrics**
| Tag | Description | Example values |
| --------------- | -------------------------------------------------- | ---------------------------------------------------------------- |
| `ws_slug` | Slug of the SuprSend workspace | `my-workspace` |
| `ws_uid` | Identifier of the SuprSend workspace (environment) | `your_ws_uid` |
| `tenant_id` | Tenant ID if the message is scoped to a tenant | `tenant_abc` |
| `category` | Preference category of the parent workflow | `transactional`, `promotional` |
| `channel` | Delivery channel used for the message | `email`, `sms`, `push`, `whatsapp`, `inbox`, `slack`, `ms_teams` |
| `vendor` | Vendor used to deliver the message | `mailgun`, `twilio`, `firebase`, `sendgrid` |
| `workflow_slug` | Slug of the workflow that generated the message | `welcome-flow`, `order-confirmation` |
* All metrics are scoped to the SuprSend environment (for example `production`, `staging`) via the `ws_uid` tag.
* For delivery, seen, and click metrics to be populated for Email, SMS, and WhatsApp, configure `https://hub.suprsend.com/webhook/*` as a callback URL in your vendor dashboard. See the [vendor integration docs](/docs/vendors) for per-vendor instructions.
* For error details, the [SuprSend dashboard](https://app.suprsend.com) provides more granular information via [Logs](/docs/logging) and [Analytics](/docs/analytics).
***
## Disabling the connector
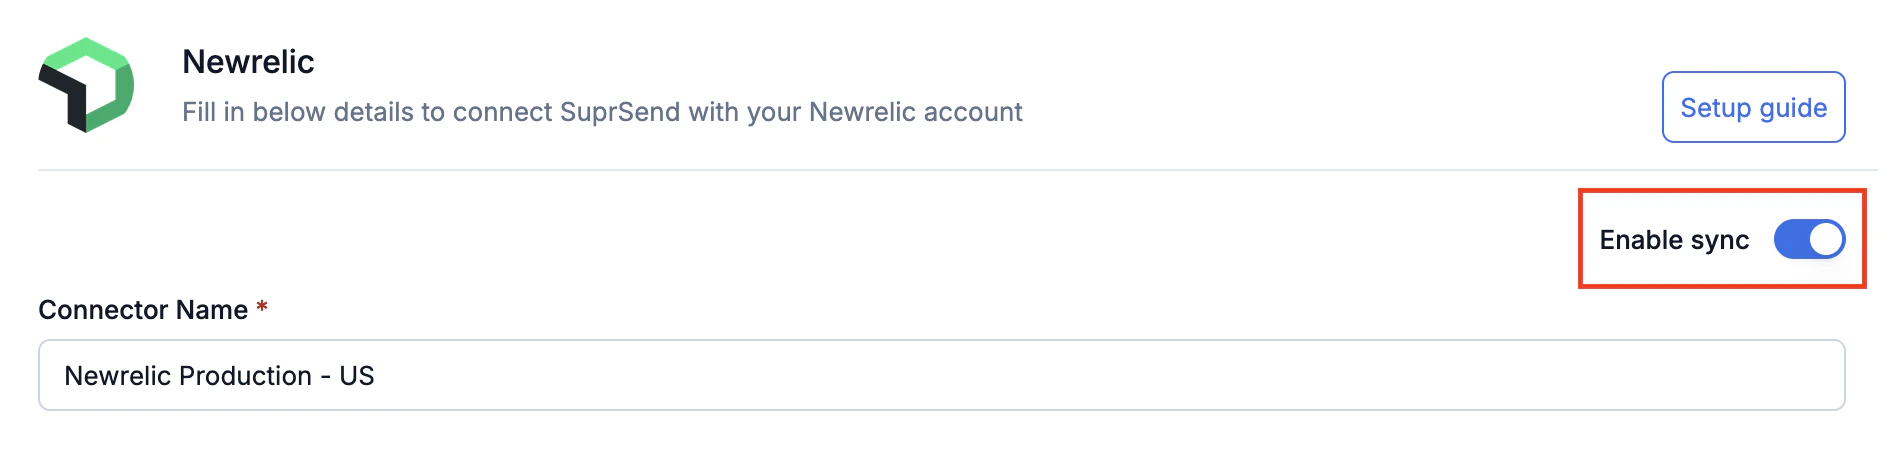
To pause metrics streaming, open the connector from the [**Connectors**](https://app.suprsend.com/connectors) page and toggle **Enable sync** off. Re-enable it at any time to resume.
8. Name the condition (for example `SuprSend — Delivery Drop Anomaly`) and attach it to an [alert policy](https://docs.newrelic.com/docs/alerts/organize-alerts/create-edit-or-find-alert-policy/).
9. Click **Save condition**.
To route alert notifications to Slack, email, or PagerDuty, set up a **Workflow** in New Relic under **Alerts → Workflows** and connect it to your alert policy. See [New Relic's workflow docs](https://docs.newrelic.com/docs/alerts/get-notified/intro-notifications/) for details.
***
## Reported metrics
SuprSend streams the following `suprsend.*` counter metrics to New Relic. All counters are monotonically increasing and represent cumulative counts from the time the connector is enabled.
### API Requests
Track the volume and health of every API call made to SuprSend.
| Metric | Description |
| ----------------------------- | -------------------------------------------------------------------------------------------------------------------------------------------------------------------- |
| `suprsend.api_request.total` | Total number of API requests received by SuprSend. Use the `status` tag to break down by outcome - `sent`, `in_progress`, `success`, `failed`, or `partial_failure`. |
| `suprsend.api_request.errors` | API requests that failed to process due to an error. Group by `api_type` to identify which endpoint is failing, and by `error_severity` to prioritize investigation. |
**Tags on API Request metrics**
| Tag | Description |
| ---------------- | --------------------------------------------------- |
| `api_type` | The SuprSend API endpoint that was called |
| `method` | HTTP method of the request |
| `status` | Outcome of the request |
| `ws_uid` | Identifier of the SuprSend workspace (environment) |
| `ws_slug` | Slug of the SuprSend workspace. Eg. `staging` |
| `tenant_id` | Tenant ID if the request is scoped to a tenant |
| `error_severity` | Severity level of the error (on error metrics only) |
### Workflow Executions
Monitor how your workflows and broadcasts are performing and quickly spot execution failures.
| Metric | Description |
| ------------------------------------- | -------------------------------------------------------------------------------------------------------------------------------------------------------------------------- |
| `suprsend.workflow_execution.total` | Total number of workflow executions started. Workflow executions are counted per-recipient. Use `workflow_slug` and `category` tags to drill down into specific workflows. |
| `suprsend.workflow_execution.errors` | Workflow executions that failed to process due to an error. |
| `suprsend.broadcast_execution.errors` | Broadcast executions that failed to process due to an error. |
**Tags on Workflow Execution metrics**
| Tag | Description | Example values |
| ---------------- | --------------------------------------------------- | ------------------------------------ |
| `workflow_slug` | Slug of the workflow that was executed | `welcome-flow`, `order-confirmation` |
| `category` | Preference category of the workflow | `transactional`, `promotional` |
| `ws_slug` | Slug of the SuprSend workspace | `my-workspace` |
| `ws_uid` | Identifier of the SuprSend workspace (environment) | `your_ws_uid` |
| `tenant_id` | Tenant ID if the workflow is scoped to a tenant | `tenant_abc` |
| `error_severity` | Severity level of the error (on error metrics only) | `critical`, `warning`, `info` |
### Messages
Follow the full lifecycle of every message - from trigger through delivery, open, and click - and monitor delivery failures by vendor and channel.
| Metric | Description |
| ----------------------------------- | ----------------------------------------------------------------------------------------------------------------------- |
| `suprsend.messages.triggered` | Total number of messages triggered. Slice by `channel` and `vendor` to see volume distribution. |
| `suprsend.messages.delivered` | Total number of messages delivered to the recipient. |
| `suprsend.messages.delivery_errors` | Messages that failed to deliver due to an error. Use `vendor` / `channel` tags to isolate the error source. |
| `suprsend.messages.seen` | Total number of messages seen by the recipient. Requires vendor webhook callbacks to be configured (see note below). |
| `suprsend.messages.clicked` | Total number of messages clicked by the recipient. Requires vendor webhook callbacks to be configured (see note below). |
**Tags on Message metrics**
| Tag | Description | Example values |
| --------------- | -------------------------------------------------- | ---------------------------------------------------------------- |
| `ws_slug` | Slug of the SuprSend workspace | `my-workspace` |
| `ws_uid` | Identifier of the SuprSend workspace (environment) | `your_ws_uid` |
| `tenant_id` | Tenant ID if the message is scoped to a tenant | `tenant_abc` |
| `category` | Preference category of the parent workflow | `transactional`, `promotional` |
| `channel` | Delivery channel used for the message | `email`, `sms`, `push`, `whatsapp`, `inbox`, `slack`, `ms_teams` |
| `vendor` | Vendor used to deliver the message | `mailgun`, `twilio`, `firebase`, `sendgrid` |
| `workflow_slug` | Slug of the workflow that generated the message | `welcome-flow`, `order-confirmation` |
* All metrics are scoped to the SuprSend environment (for example `production`, `staging`) via the `ws_uid` tag.
* For delivery, seen, and click metrics to be populated for Email, SMS, and WhatsApp, configure `https://hub.suprsend.com/webhook/*` as a callback URL in your vendor dashboard. See the [vendor integration docs](/docs/vendors) for per-vendor instructions.
* For error details, the [SuprSend dashboard](https://app.suprsend.com) provides more granular information via [Logs](/docs/logging) and [Analytics](/docs/analytics).
***
## Disabling the connector
To pause metrics streaming, open the connector from the [**Connectors**](https://app.suprsend.com/connectors) page and toggle **Enable sync** off. Re-enable it at any time to resume.