> ## Documentation Index
> Fetch the complete documentation index at: https://docs.suprsend.com/llms.txt
> Use this file to discover all available pages before exploring further.
# OpenTelemetry
> Stream real-time notification metrics from SuprSend to any OpenTelemetry-compatible observability platform via OTLP for API, delivery, and vendor tracking.
The SuprSend OTel connector streams notification metrics via the [OpenTelemetry Protocol (OTLP)](https://opentelemetry.io/) over HTTP in near real-time - with latency under **1 minute**. It covers three key areas of your notification pipeline:
Track every API call hitting SuprSend - success/failure counts, error breakdowns, and request volume over time.
Monitor workflow performance, catch execution errors early, and identify top failing workflows.
Follow the full message lifecycle - triggered, delivered, seen, clicked - with delivery errors by vendor and channel.
Use it to connect SuprSend to any platform that accepts OTLP, including Grafana Cloud, Prometheus, Honeycomb, Dynatrace, or your own self-hosted OTel Collector.
Connecting to **Datadog** or **New Relic**? Use our dedicated connectors with pre-built dashboard starter kits - [Datadog connector](/docs/datadog) · [New Relic connector](/docs/new-relic)
**Enterprise plan feature.** The SuprSend OTel connector is only available on our [Enterprise plan](https://suprsend.com/pricing).
## How it works
SuprSend exports `suprsend.*` metrics via OTLP over HTTP. You provide your **OTLP endpoint** and **authentication headers**, choose which events to sync, and SuprSend streams them in near real-time - with latency **under 1 minute**.
Once connected you can **build custom dashboards**, **set up alerts** for delivery failures or API errors, **slice by any dimension** (workspace, tenant, workflow, channel, vendor, template), and **correlate notification health with your infrastructure and APM data**.
All metrics are tagged by workspace, tenant, workflow, category, channel, vendor, template, node, and error details. See [Reported metrics](#reported-metrics) for the full list.
Please refer to your observability platform's pricing agreement for information on how custom metrics ingested via OTLP are priced.
***
## Installing the connector
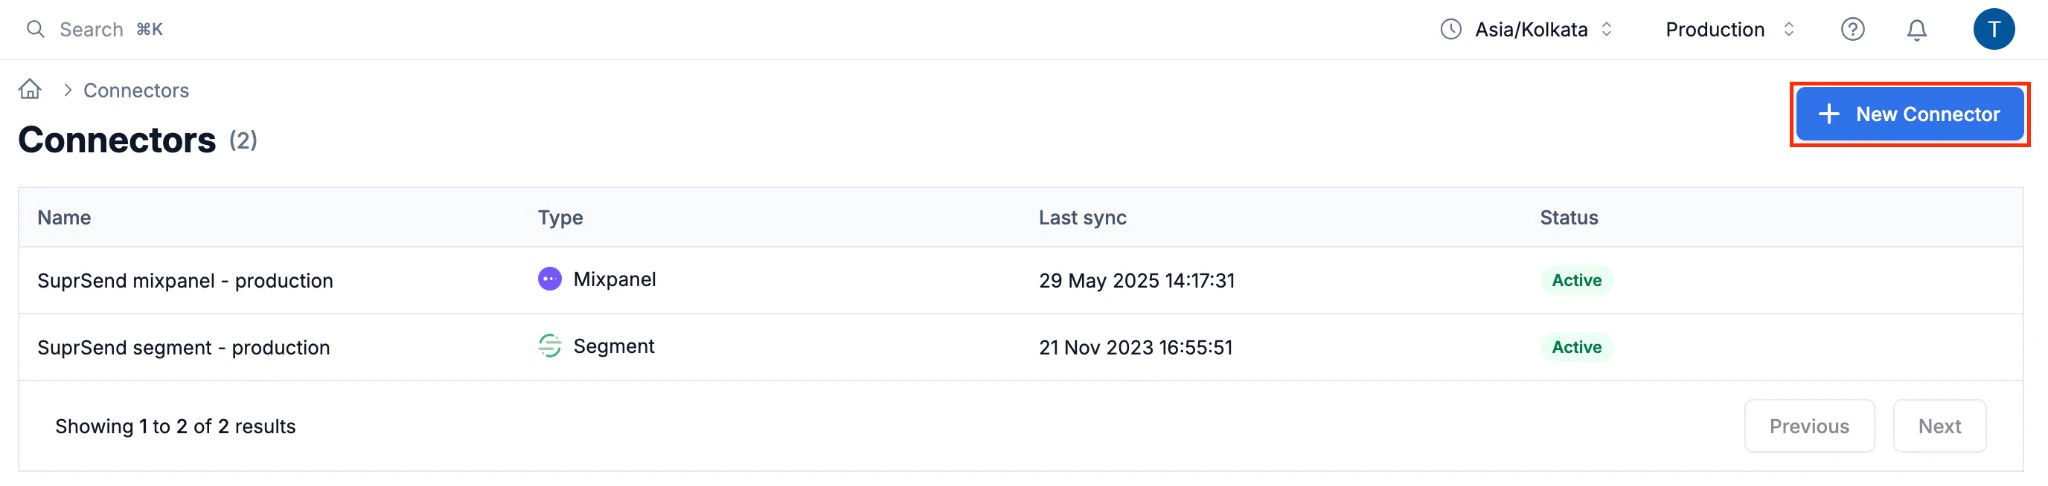
In your SuprSend dashboard, navigate to [**Connectors**](https://app.suprsend.com/connectors) and click **New Connector**.
 Fill in the following fields:
| Field | Description |
| ------------------ | ---------------------------------------------------------------------------------------------------------------------------------------- |
| **Connector Name** | A label to identify this connector (for example `Grafana Cloud Production`) |
| **Tool Used** | The name of the observability tool you are connecting to (for example `Grafana Cloud`) |
| **OTLP Endpoint** | Your platform's OTLP HTTP endpoint URL (for example `https://otlp-gateway-prod-us-east-0.grafana.net/otlp/v1/metrics`) |
| **Headers** | One or more HTTP headers for authentication. Click **+ Add Header** to add key/value pairs (see [Authentication](#authentication) below) |
| **Events to sync** | One or more metric events to export (see [Reported metrics](#reported-metrics)) |
| **Protocol** | HTTP |
Click **Save**. Your metrics will start streaming to your platform within a few minutes.
***
## Authentication
SuprSend passes authentication credentials as HTTP headers. The header format depends on your platform:
| Auth type | Header key | Header value | Used by |
| ------------- | --------------- | ----------------------------------- | ----------------------------- |
| Bearer token | `Authorization` | `Bearer ` | Datadog, Honeycomb, Dynatrace |
| Basic auth | `Authorization` | `Basic ` | Grafana Cloud |
| Custom header | varies | varies | Self-hosted collectors |
We recommend creating a dedicated API key or token specifically for SuprSend so you can rotate or revoke it independently without affecting other integrations.
***
## Reported metrics
SuprSend streams the following `suprsend.*` counter metrics. All counters are monotonically increasing and represent cumulative counts from the time the connector is enabled.
### API Requests
Track the volume and health of every API call made to SuprSend.
| Metric | Description |
| ----------------------------- | -------------------------------------------------------------------------------------------------------------------------------------------------------------------- |
| `suprsend.api_request.total` | Total number of API requests received by SuprSend. Use the `status` tag to break down by outcome - `sent`, `in_progress`, `success`, `failed`, or `partial_failure`. |
| `suprsend.api_request.errors` | API requests that failed to process due to an error. Group by `api_type` to identify which endpoint is failing, and by `error_severity` to prioritize investigation. |
**Tags on API Request metrics**
| Tag | Description | Example values |
| ---------------- | --------------------------------------------------- | ------------------------------------------------------------- |
| `api_type` | The SuprSend API endpoint that was called | `workflow_trigger`, `broadcast_trigger`, `user_edit`, `event` |
| `method` | HTTP method of the request | `POST`, `GET`, `PUT`, `PATCH` |
| `status` | Outcome of the request | `sent`, `in_progress`, `success`, `failed`, `partial_failure` |
| `ws_uid` | Identifier of the SuprSend workspace (environment) | `your_ws_uid` |
| `ws_slug` | Slug of the SuprSend workspace. Eg. `staging` | |
| `tenant_id` | Tenant ID if the request is scoped to a tenant | `tenant_abc` |
| `error_severity` | Severity level of the error (on error metrics only) | `critical`, `warning`, `info` |
### Workflow Executions
Monitor how your workflows and broadcasts are performing and quickly spot execution failures.
| Metric | Description |
| ------------------------------------- | -------------------------------------------------------------------------------------------------------------------------------------------------------------------------- |
| `suprsend.workflow_execution.total` | Total number of workflow executions started. Workflow executions are counted per-recipient. Use `workflow_slug` and `category` tags to drill down into specific workflows. |
| `suprsend.workflow_execution.errors` | Workflow executions that failed to process due to an error. |
| `suprsend.broadcast_execution.errors` | Broadcast executions that failed to process due to an error. |
**Tags on Workflow Execution metrics**
| Tag | Description | Example values |
| ---------------- | --------------------------------------------------- | ------------------------------------ |
| `workflow_slug` | Slug of the workflow that was executed | `welcome-flow`, `order-confirmation` |
| `category` | Preference category of the workflow | `transactional`, `promotional` |
| `ws_slug` | Slug of the SuprSend workspace | `my-workspace` |
| `ws_uid` | Identifier of the SuprSend workspace (environment) | `your_ws_uid` |
| `tenant_id` | Tenant ID if the workflow is scoped to a tenant | `tenant_abc` |
| `error_severity` | Severity level of the error (on error metrics only) | `critical`, `warning`, `info` |
### Messages
Follow the full lifecycle of every message - from trigger through delivery, open, and click - and monitor delivery failures by vendor and channel.
| Metric | Description |
| ----------------------------------- | ----------------------------------------------------------------------------------------------------------------------- |
| `suprsend.messages.triggered` | Total number of messages triggered. Slice by `channel` and `vendor` to see volume distribution. |
| `suprsend.messages.delivered` | Total number of messages delivered to the recipient. |
| `suprsend.messages.delivery_errors` | Messages that failed to deliver due to an error. Use `vendor` / `channel` tags to isolate the error source. |
| `suprsend.messages.seen` | Total number of messages seen by the recipient. Requires vendor webhook callbacks to be configured (see note below). |
| `suprsend.messages.clicked` | Total number of messages clicked by the recipient. Requires vendor webhook callbacks to be configured (see note below). |
**Tags on Message metrics**
| Tag | Description | Example values |
| --------------- | -------------------------------------------------- | ---------------------------------------------------------------- |
| `ws_slug` | Slug of the SuprSend workspace | `my-workspace` |
| `ws_uid` | Identifier of the SuprSend workspace (environment) | `your_ws_uid` |
| `tenant_id` | Tenant ID if the message is scoped to a tenant | `tenant_abc` |
| `category` | Preference category of the parent workflow | `transactional`, `promotional` |
| `channel` | Delivery channel used for the message | `email`, `sms`, `push`, `whatsapp`, `inbox`, `slack`, `ms_teams` |
| `vendor` | Vendor used to deliver the message | `mailgun`, `twilio`, `firebase`, `sendgrid`, etc. |
| `workflow_slug` | Slug of the workflow that generated the message | `welcome-flow`, `order-confirmation` |
* All metrics are scoped to the SuprSend environment (for example `production`, `staging`) via the `ws_uid` tag.
* For delivery, seen, and click metrics to be populated for Email, SMS, and WhatsApp, configure `https://hub.suprsend.com/webhook/*` as a callback URL in your vendor dashboard. See the [vendor integration docs](/docs/vendors) for per-vendor instructions.
* For error details, the [SuprSend dashboard](https://app.suprsend.com) provides more granular information via [Logs](/docs/logging) and [Analytics](/docs/analytics).
***
## Disabling the connector
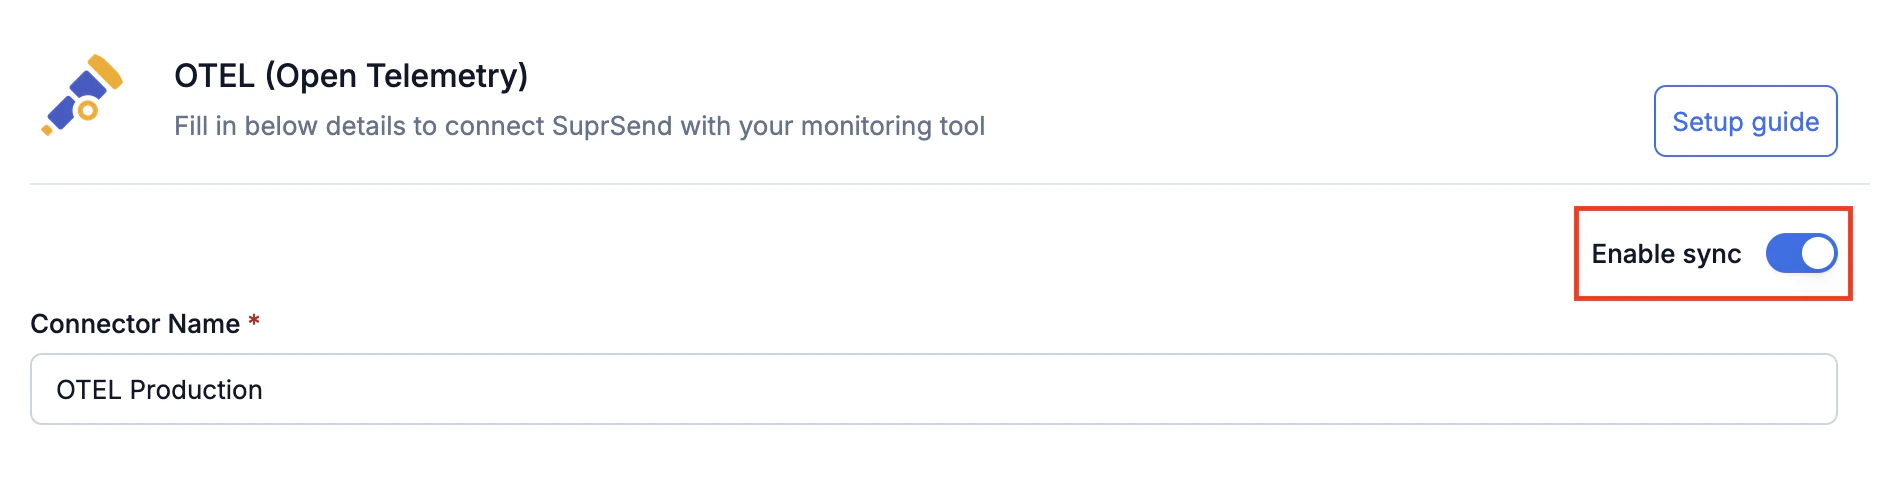
To pause metrics streaming, open the connector from the [**Connectors**](https://app.suprsend.com/connectors) page and toggle **Enable sync** off. Re-enable it at any time to resume.
Fill in the following fields:
| Field | Description |
| ------------------ | ---------------------------------------------------------------------------------------------------------------------------------------- |
| **Connector Name** | A label to identify this connector (for example `Grafana Cloud Production`) |
| **Tool Used** | The name of the observability tool you are connecting to (for example `Grafana Cloud`) |
| **OTLP Endpoint** | Your platform's OTLP HTTP endpoint URL (for example `https://otlp-gateway-prod-us-east-0.grafana.net/otlp/v1/metrics`) |
| **Headers** | One or more HTTP headers for authentication. Click **+ Add Header** to add key/value pairs (see [Authentication](#authentication) below) |
| **Events to sync** | One or more metric events to export (see [Reported metrics](#reported-metrics)) |
| **Protocol** | HTTP |
Click **Save**. Your metrics will start streaming to your platform within a few minutes.
***
## Authentication
SuprSend passes authentication credentials as HTTP headers. The header format depends on your platform:
| Auth type | Header key | Header value | Used by |
| ------------- | --------------- | ----------------------------------- | ----------------------------- |
| Bearer token | `Authorization` | `Bearer ` | Datadog, Honeycomb, Dynatrace |
| Basic auth | `Authorization` | `Basic ` | Grafana Cloud |
| Custom header | varies | varies | Self-hosted collectors |
We recommend creating a dedicated API key or token specifically for SuprSend so you can rotate or revoke it independently without affecting other integrations.
***
## Reported metrics
SuprSend streams the following `suprsend.*` counter metrics. All counters are monotonically increasing and represent cumulative counts from the time the connector is enabled.
### API Requests
Track the volume and health of every API call made to SuprSend.
| Metric | Description |
| ----------------------------- | -------------------------------------------------------------------------------------------------------------------------------------------------------------------- |
| `suprsend.api_request.total` | Total number of API requests received by SuprSend. Use the `status` tag to break down by outcome - `sent`, `in_progress`, `success`, `failed`, or `partial_failure`. |
| `suprsend.api_request.errors` | API requests that failed to process due to an error. Group by `api_type` to identify which endpoint is failing, and by `error_severity` to prioritize investigation. |
**Tags on API Request metrics**
| Tag | Description | Example values |
| ---------------- | --------------------------------------------------- | ------------------------------------------------------------- |
| `api_type` | The SuprSend API endpoint that was called | `workflow_trigger`, `broadcast_trigger`, `user_edit`, `event` |
| `method` | HTTP method of the request | `POST`, `GET`, `PUT`, `PATCH` |
| `status` | Outcome of the request | `sent`, `in_progress`, `success`, `failed`, `partial_failure` |
| `ws_uid` | Identifier of the SuprSend workspace (environment) | `your_ws_uid` |
| `ws_slug` | Slug of the SuprSend workspace. Eg. `staging` | |
| `tenant_id` | Tenant ID if the request is scoped to a tenant | `tenant_abc` |
| `error_severity` | Severity level of the error (on error metrics only) | `critical`, `warning`, `info` |
### Workflow Executions
Monitor how your workflows and broadcasts are performing and quickly spot execution failures.
| Metric | Description |
| ------------------------------------- | -------------------------------------------------------------------------------------------------------------------------------------------------------------------------- |
| `suprsend.workflow_execution.total` | Total number of workflow executions started. Workflow executions are counted per-recipient. Use `workflow_slug` and `category` tags to drill down into specific workflows. |
| `suprsend.workflow_execution.errors` | Workflow executions that failed to process due to an error. |
| `suprsend.broadcast_execution.errors` | Broadcast executions that failed to process due to an error. |
**Tags on Workflow Execution metrics**
| Tag | Description | Example values |
| ---------------- | --------------------------------------------------- | ------------------------------------ |
| `workflow_slug` | Slug of the workflow that was executed | `welcome-flow`, `order-confirmation` |
| `category` | Preference category of the workflow | `transactional`, `promotional` |
| `ws_slug` | Slug of the SuprSend workspace | `my-workspace` |
| `ws_uid` | Identifier of the SuprSend workspace (environment) | `your_ws_uid` |
| `tenant_id` | Tenant ID if the workflow is scoped to a tenant | `tenant_abc` |
| `error_severity` | Severity level of the error (on error metrics only) | `critical`, `warning`, `info` |
### Messages
Follow the full lifecycle of every message - from trigger through delivery, open, and click - and monitor delivery failures by vendor and channel.
| Metric | Description |
| ----------------------------------- | ----------------------------------------------------------------------------------------------------------------------- |
| `suprsend.messages.triggered` | Total number of messages triggered. Slice by `channel` and `vendor` to see volume distribution. |
| `suprsend.messages.delivered` | Total number of messages delivered to the recipient. |
| `suprsend.messages.delivery_errors` | Messages that failed to deliver due to an error. Use `vendor` / `channel` tags to isolate the error source. |
| `suprsend.messages.seen` | Total number of messages seen by the recipient. Requires vendor webhook callbacks to be configured (see note below). |
| `suprsend.messages.clicked` | Total number of messages clicked by the recipient. Requires vendor webhook callbacks to be configured (see note below). |
**Tags on Message metrics**
| Tag | Description | Example values |
| --------------- | -------------------------------------------------- | ---------------------------------------------------------------- |
| `ws_slug` | Slug of the SuprSend workspace | `my-workspace` |
| `ws_uid` | Identifier of the SuprSend workspace (environment) | `your_ws_uid` |
| `tenant_id` | Tenant ID if the message is scoped to a tenant | `tenant_abc` |
| `category` | Preference category of the parent workflow | `transactional`, `promotional` |
| `channel` | Delivery channel used for the message | `email`, `sms`, `push`, `whatsapp`, `inbox`, `slack`, `ms_teams` |
| `vendor` | Vendor used to deliver the message | `mailgun`, `twilio`, `firebase`, `sendgrid`, etc. |
| `workflow_slug` | Slug of the workflow that generated the message | `welcome-flow`, `order-confirmation` |
* All metrics are scoped to the SuprSend environment (for example `production`, `staging`) via the `ws_uid` tag.
* For delivery, seen, and click metrics to be populated for Email, SMS, and WhatsApp, configure `https://hub.suprsend.com/webhook/*` as a callback URL in your vendor dashboard. See the [vendor integration docs](/docs/vendors) for per-vendor instructions.
* For error details, the [SuprSend dashboard](https://app.suprsend.com) provides more granular information via [Logs](/docs/logging) and [Analytics](/docs/analytics).
***
## Disabling the connector
To pause metrics streaming, open the connector from the [**Connectors**](https://app.suprsend.com/connectors) page and toggle **Enable sync** off. Re-enable it at any time to resume.