Requests
All API/SDK requests made to SuprSend are logged here. You can see the input payload and request response here.
Workflow Executions
Workflow trigger and event requests resulting in workflow execution are logged here. You can use this to see step by step workflow execution.
Broadcast Executions
All broadcast executions are logged here. You can see the summarized step by step execution of the broadcast.
Messages
Log of all delivery nodes (including webhooks) are tracked here along with their message status (delivered, seen, clicked).
Log Types
Requests
You can check the request payload and response of all API/SDK requests made to SuprSend here. Workflow errors which are detected before workflow execution are also logged here (eg. Trigger condition mismatch, workflow not found and recipient not found).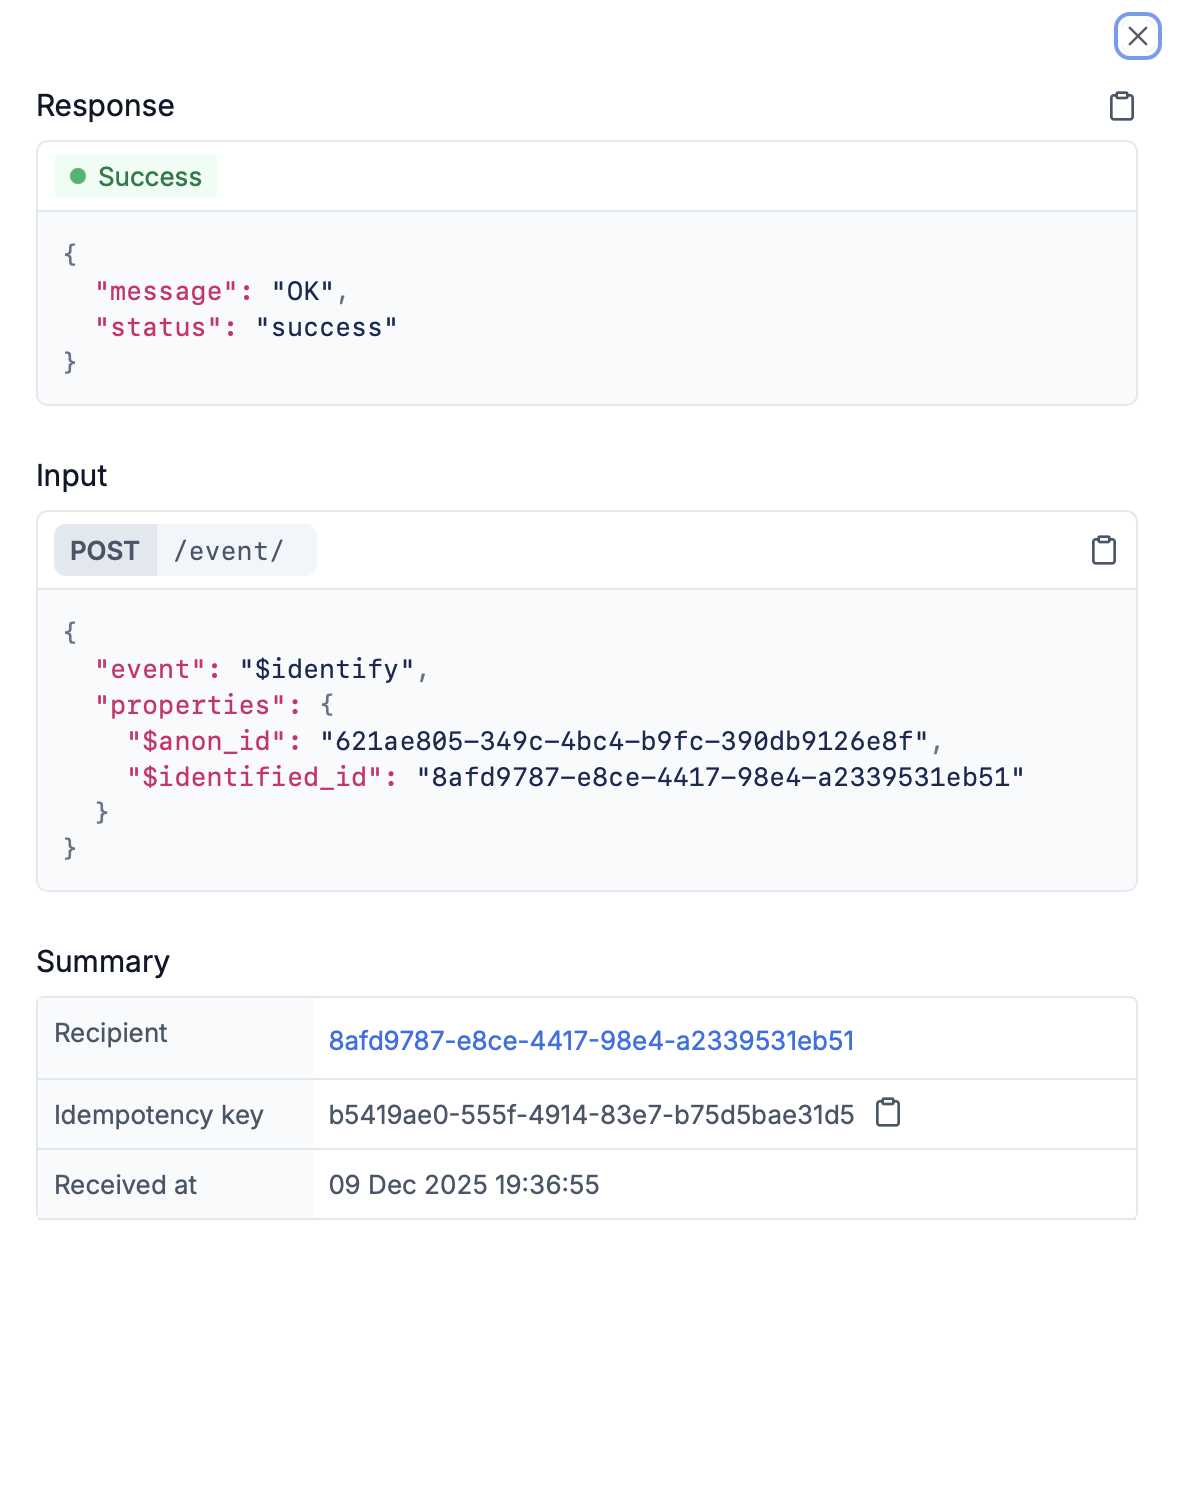
Request log entry details
Status indicators:
Common errors captured:
Navigate from here:
- Workflow trigger / event requests: View execution details in the Workflow Executions log. The linked execution is available in the expanded request log.
- Broadcast requests: View execution details in the Broadcast Executions log.
- Other requests: The Request Logs show the final response status and error details.
Workflow Executions
Workflow execution logs show how individual workflows are processed for each user and show step-by-step workflow execution details. You can see how each node in the workflow is executed. All the errors that happen during workflow execution are logged here, except delivery errors since they are reported later by vendor and is tracked in Message Logs.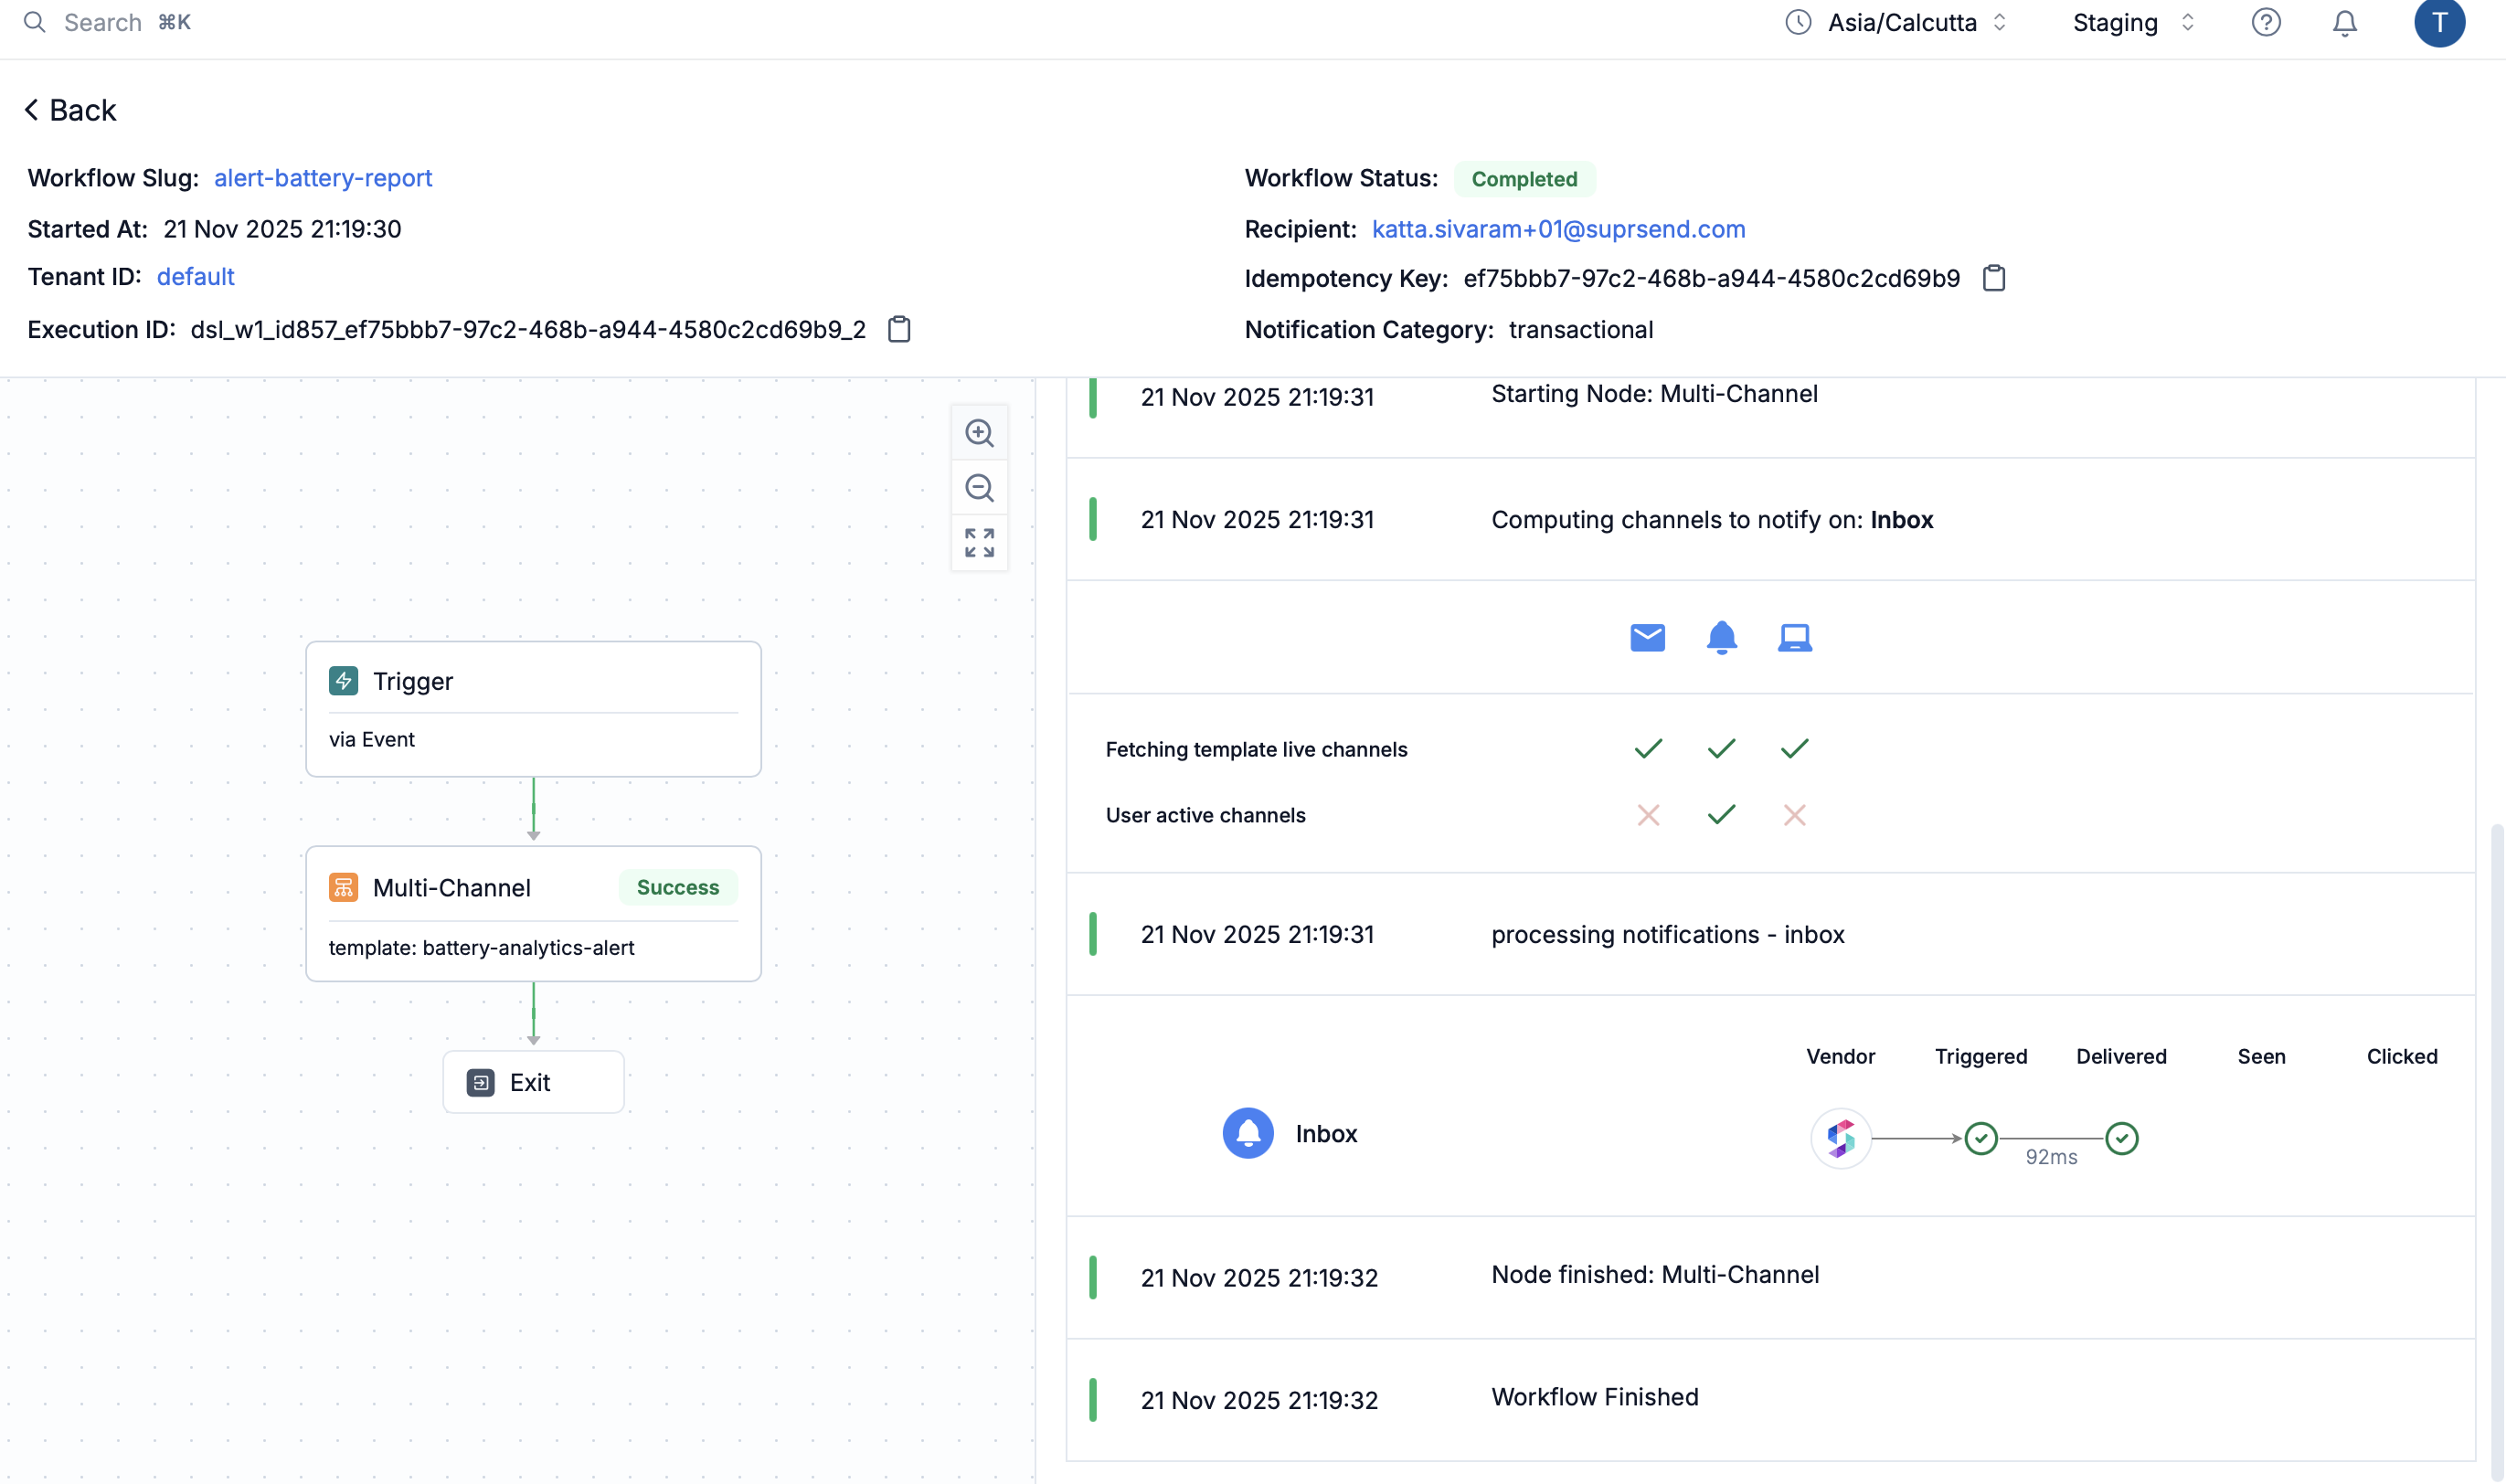
-
Overview: Generic information about the workflow execution:
- Workflow slug, tenant ID and Recipient (clickable)
- Execution ID (share this with SuprSend support if you need help in debugging the workflow or want to report an issue)
- Idempotency key (unique identifier of the request passed to SuprSend)
- Status (Completed, Partial Failure, Failed)
- Start time (workflow start timestamp)
- Preference category
- Workflow diagram: Visual path of the execution and color coded status against each node. Check the failed nodes for error details.
- Execution history: Chronological logs of workflow start, node execution, channel computation, template rendering, and notification triggers.
Common errors captured:
Any error that can be evaluated within SuprSend are logged here, except for delivery errors which are tracked in Message Logs.
Navigate from here: If your workflow execution has delivery or webhook nodes, their corresponding logs are available in Message Logs. Click on view message logs in delivery nodes to navigate to the corresponding message log.
Broadcast Executions
Broadcast execution logs track broadcast campaigns sent to user lists. Unlike workflow execution logs which are per-user, broadcast logs provide a summary of execution across a list of users, showing aggregate statistics and processing steps.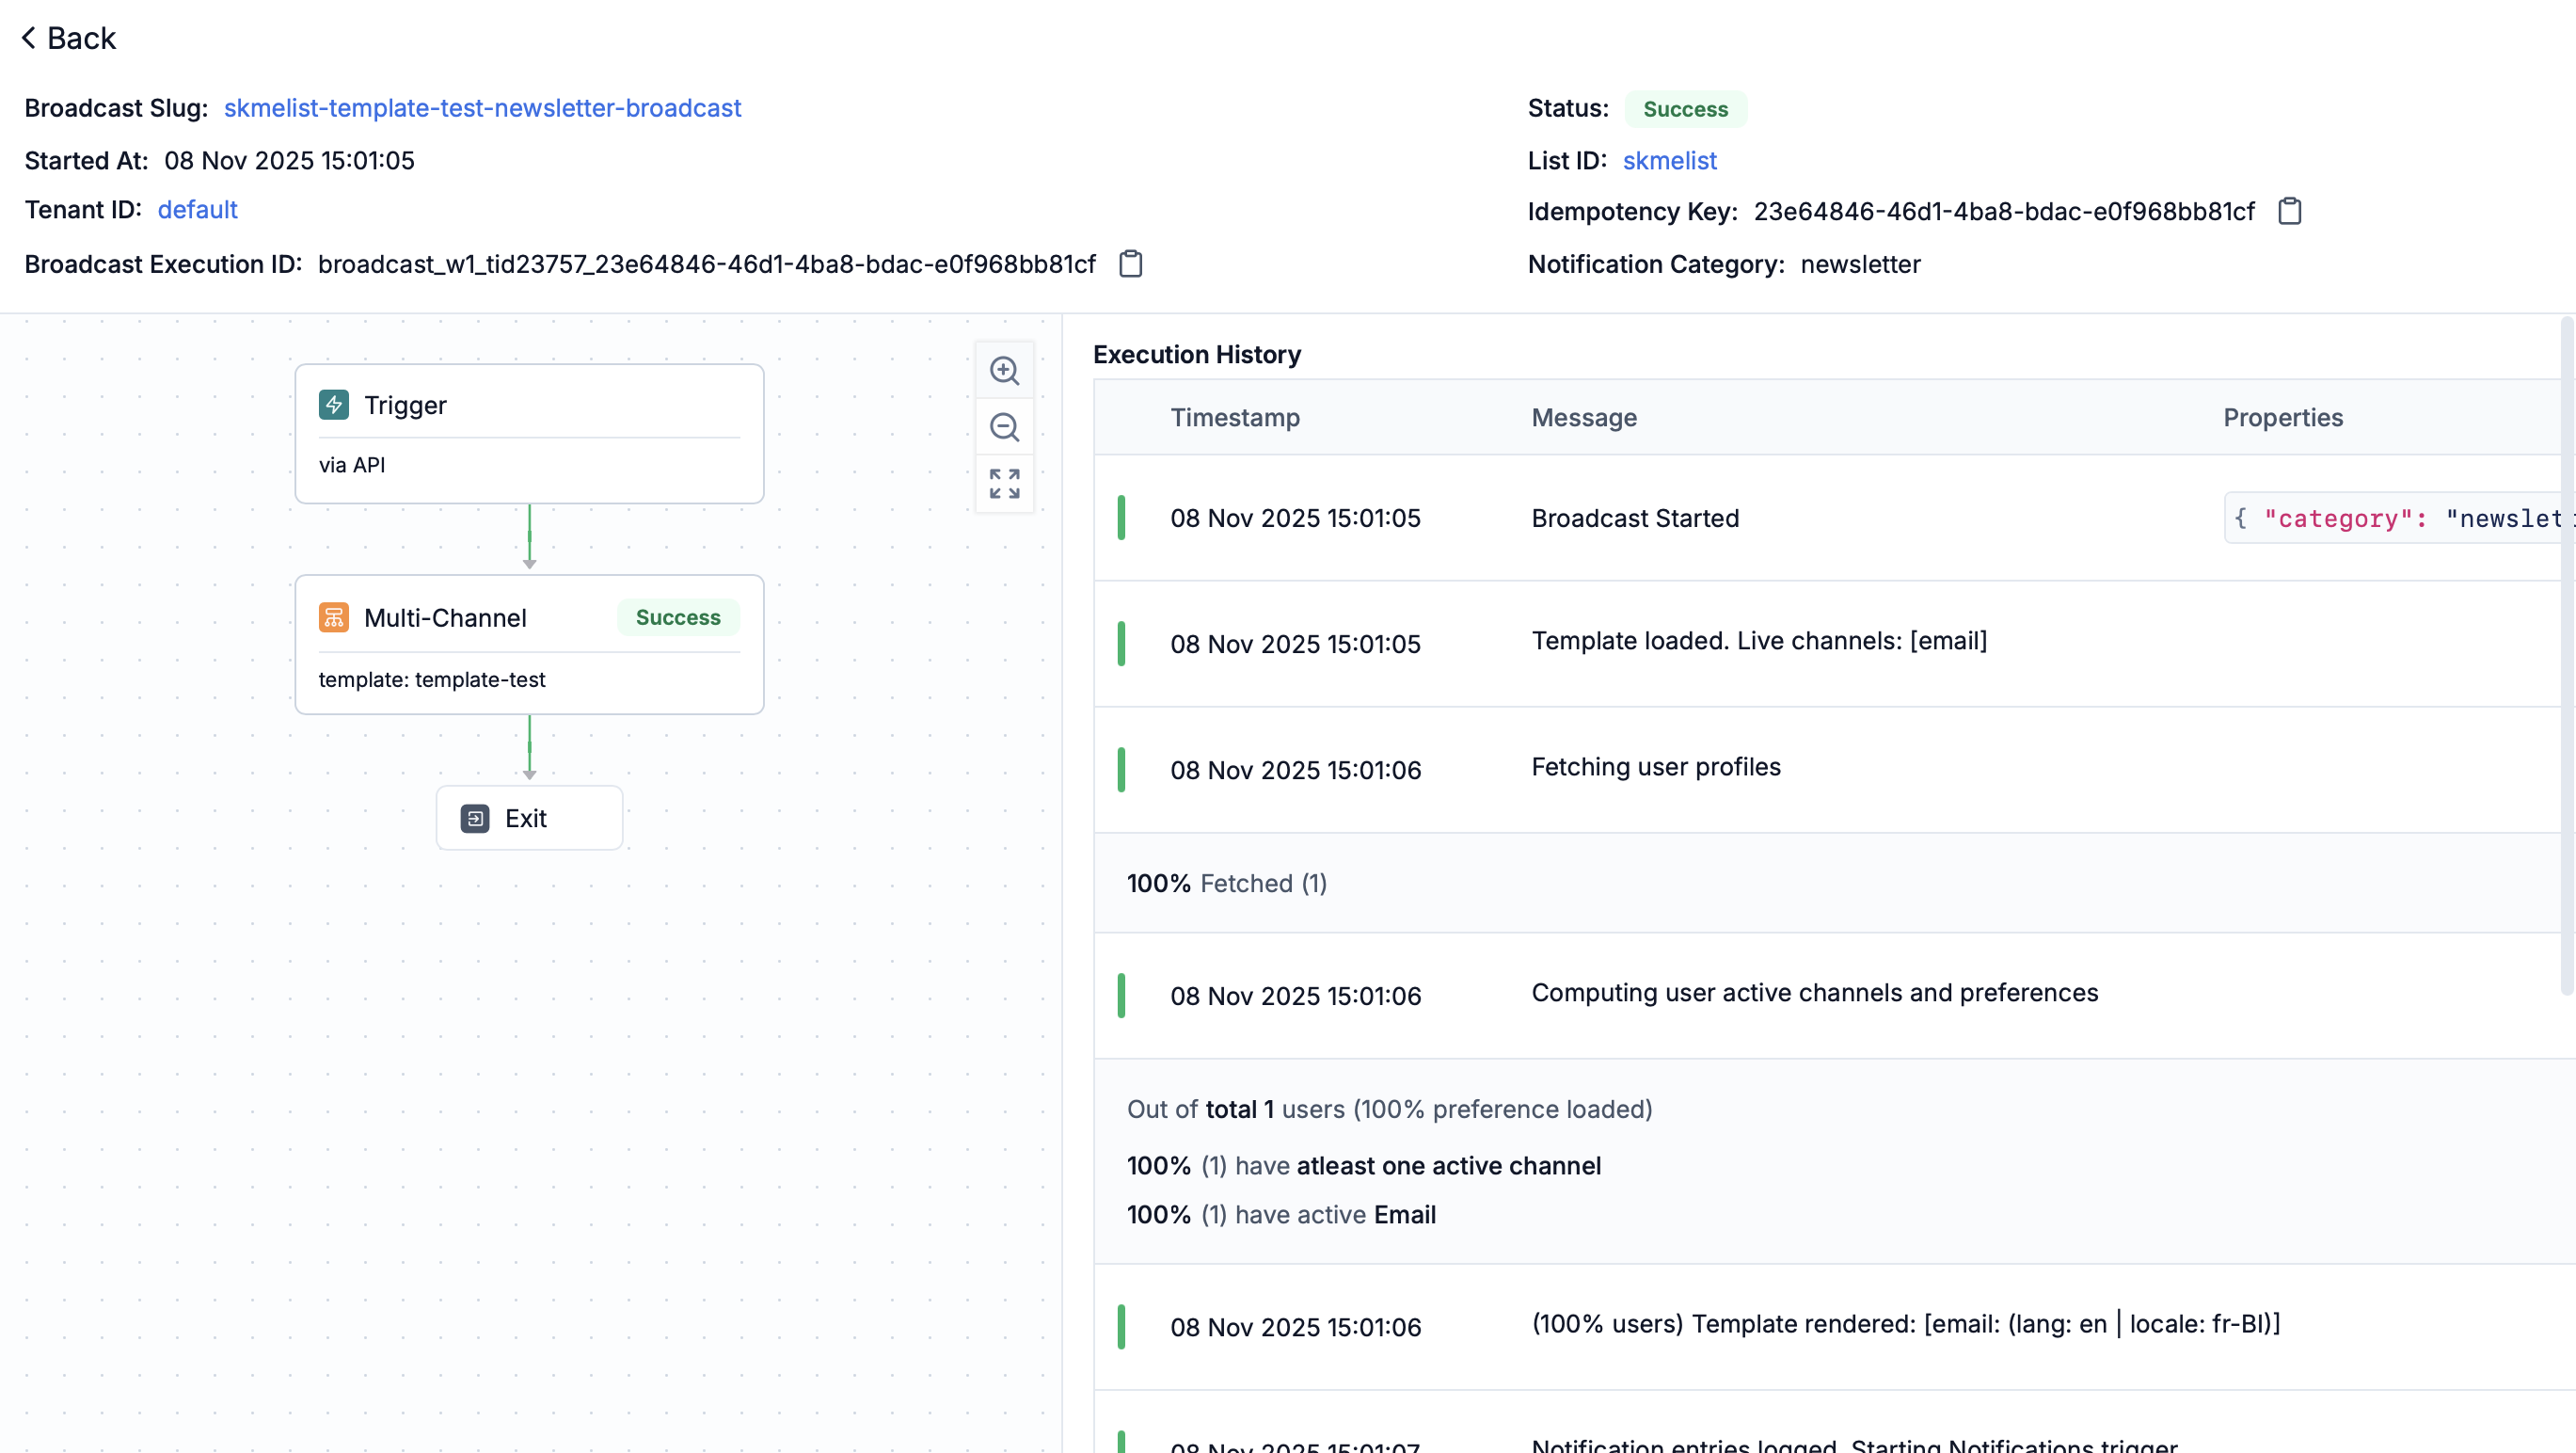
- Overview: Generic information about the broadcast execution:
- Broadcast slug, tenant ID and List ID (clickable)
- Broadcast Execution ID (share this with SuprSend support if you need help in debugging the broadcast or want to report an issue)
- Idempotency key (unique identifier of the request passed to SuprSend)
- Status (Triggered, Skipped, Failed)
- Start time (broadcast start timestamp)
- Preference category
- Execution history: Chronological logs of broadcast start, template loading, user profile fetching (with progress percentage), channel computation, template rendering, and notification triggering.
- Aggregate statistics: Summary of the broadcast performance:
- Total users processed (percentage and count) at each stage of the broadcast execution
- At delivery stage: Preference evaluation, messages triggered and delivery status (delivered, seen, clicked)
Common errors captured:
Why execution is skipped:
Navigate from here: Successful broadcasts will have delivery logs available in Message Logs. Click “View all message logs” next to delivery step to navigate directly to individual message delivery status for all users in the broadcast.
Messages
Message logs show individual notification messages, their delivery errors and engagement status. You’ll see 1 log entry corresponding to each delivery node or webhook node in the workflow or broadcast execution. Use this to track the delivery errors, notification engagement status, webhook request and response details or any other errors that happen for deivery node during the workflow or broadcast execution.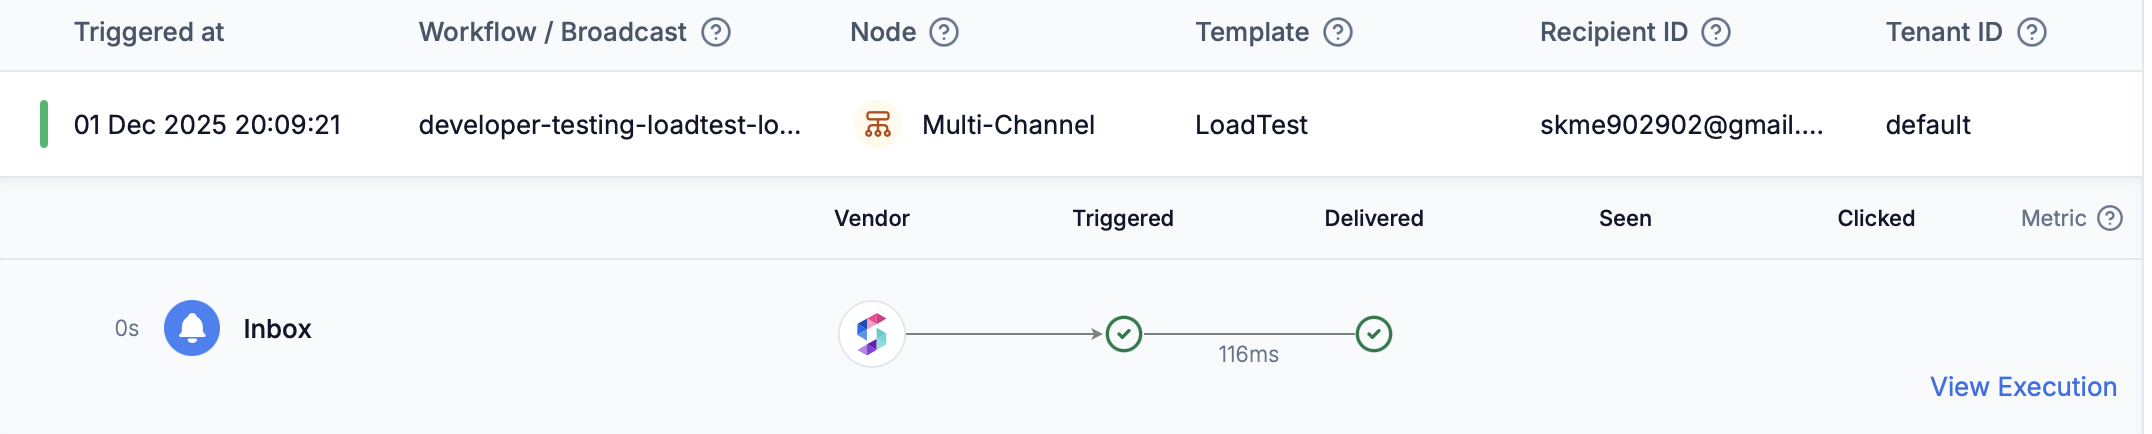
- Overview: Generic information about the message:
- Triggered at timestamp, workflow/broadcast name, node (for example, Multi-Channel, Email, SMS, Mobile Push, Inbox), template, recipient ID, and tenant ID.
- Notification Status: Triggered, Delivered, Seen, Clicked, Failed
- Delivery errors: Delivery errors if any
- Delivery timeline: Delivery timeline for the message
- Webhook request and response: Webhook request and response details if any
- Execution Error: Workflow execution error for delivery or webhook node if any
Notification Delivery and Engagement Status:
Hover over status indicators to see the timestamp of each stage and if failed, the reason for failure.
Engagement status tracked across channels:
Configure
https://hub.suprsend.com/webhook/* in your vendor dashboard to track delivery, seen, and click events for email, SMS and WhatsApp.Delay in updating the status: Some events (delivery/seen/click) depend on vendor callbacks and may appear with delay.
Navigating Logs Page
Refresh Interval
Logs are auto-refreshed every 20 seconds by default. You can manually refresh the logs by clicking the refresh button. You can also pause auto-refresh if you’re investigating a specific issue to prevent new logs from changing your view.Filters
You have global filters to drill down logs like date range and then you have tab specific filters to filter logs by status, error severity, idempotency key, recipient, object, and tenant ID etc. Fastest ways to find something:- Looking for end-to-end trace of a particular request? → Paste idempotency key in the filter to trace the notification end-to-end across all log types
- Looking for a recipient log history? → Navigate to Users tab and check all users inside user details page or filter by recipient ID or email address in logs page
- Checking why a notification was not delivered? → Check message logs for delivery errors. If not found, check workflow execution logs for any error in node execution. If still not found, check request logs and see if the workflow was triggered for the user.
- Tracing all executions for an object? → Filter by object ID on workflow execution and messages logs.
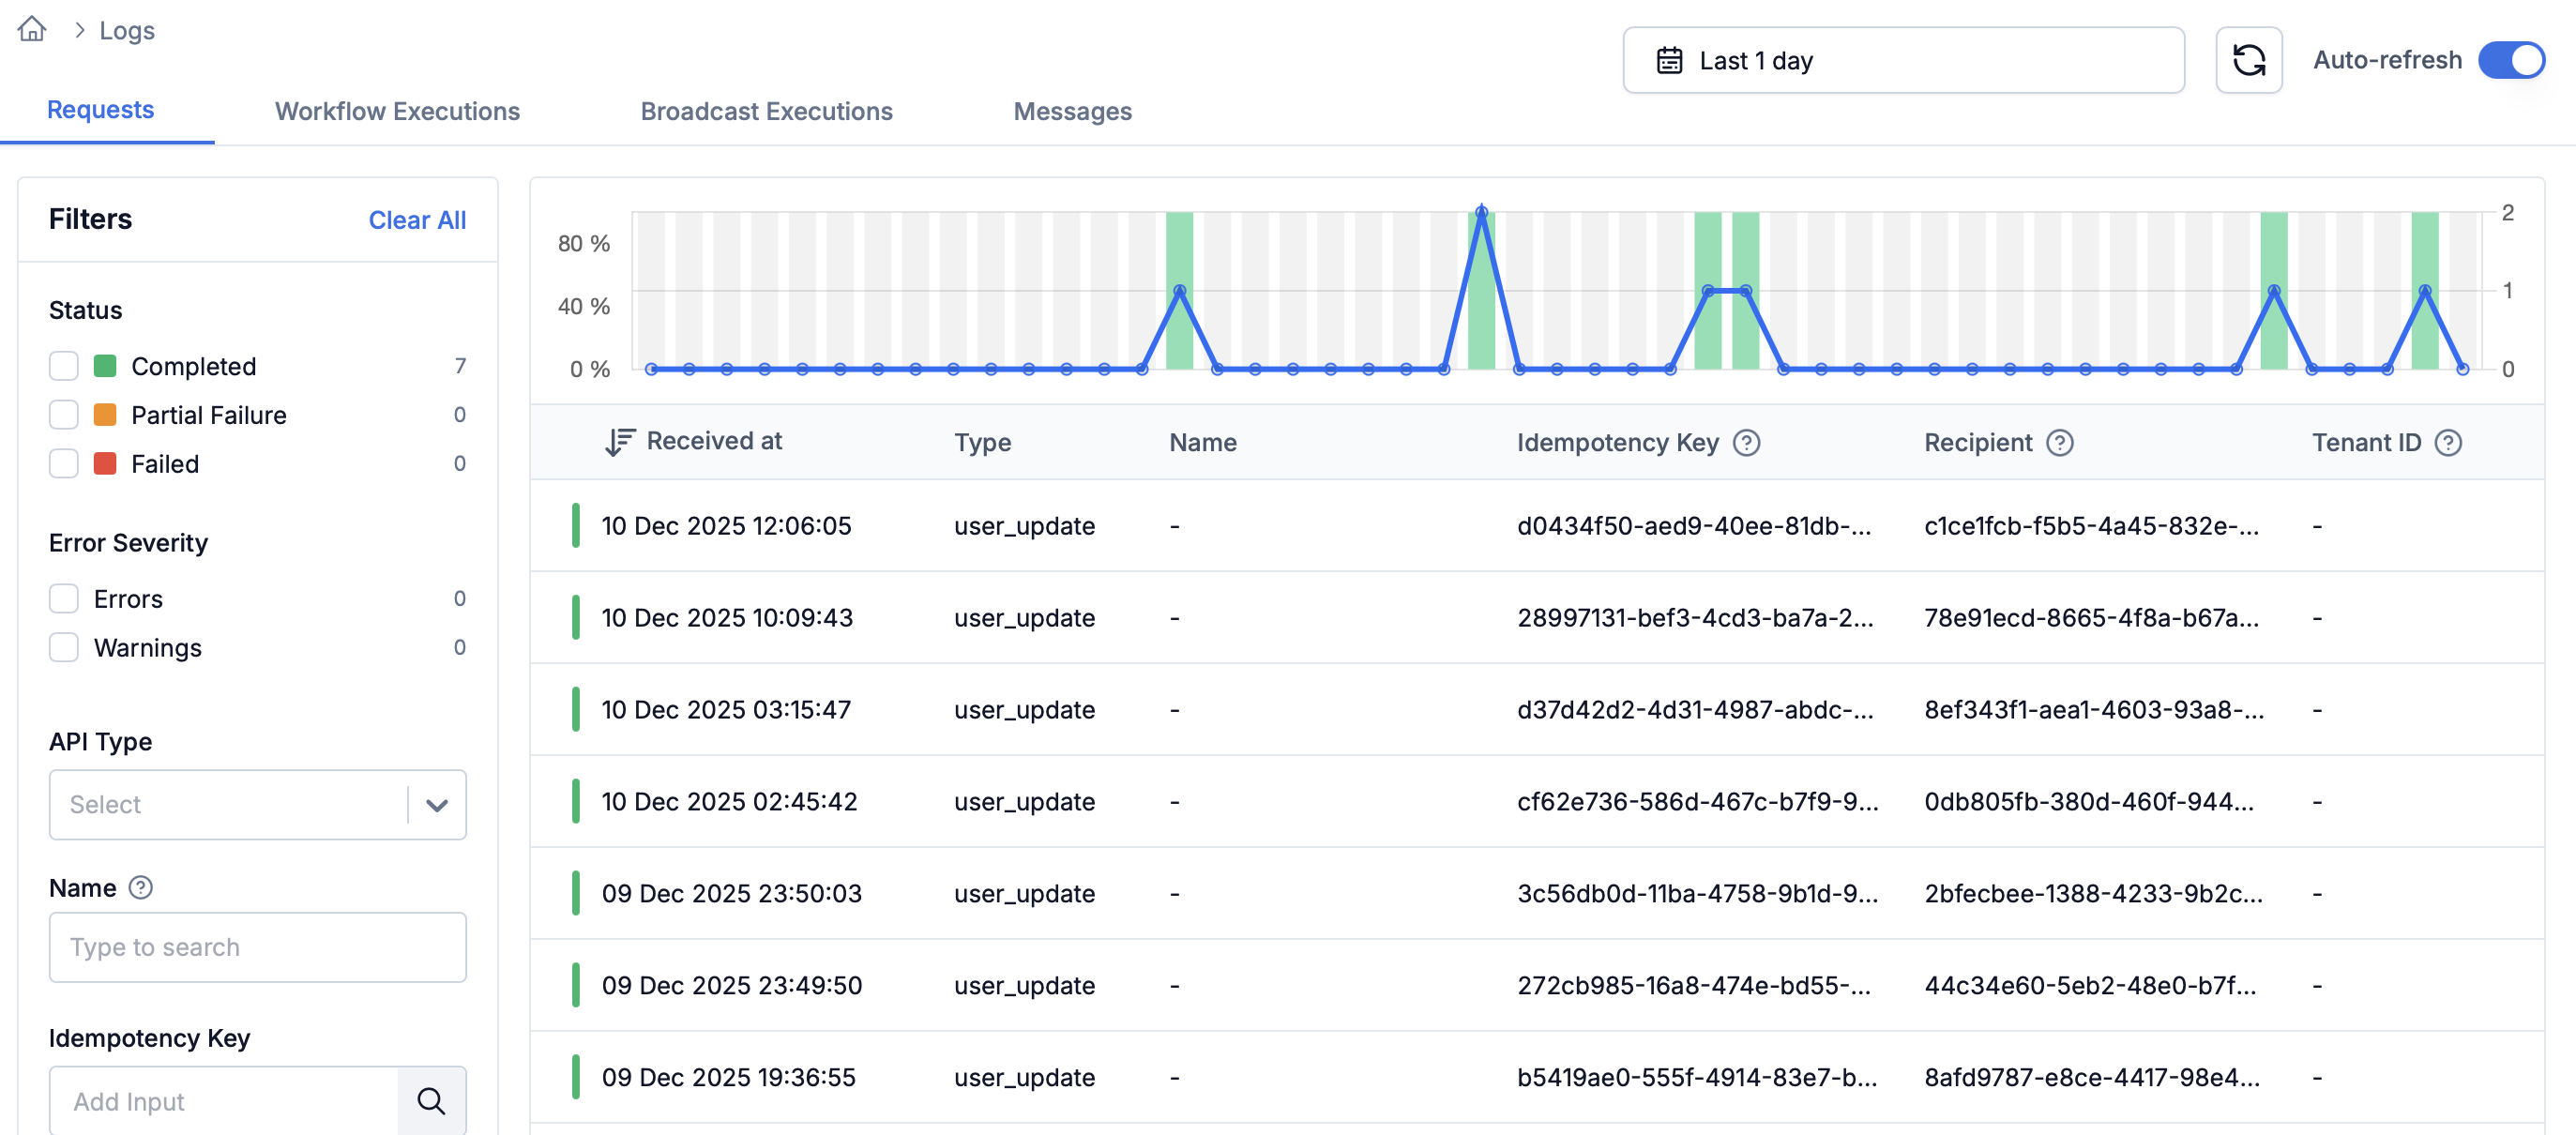
Filters panel for narrowing logs
Charts with drag-to-zoom capability
The request logs page displays an interactive graph showing request volume over time. Hover over any point to see date/time range, total requests, and success/failed/partial failure percentages. Click or drag to zoom into specific time periods.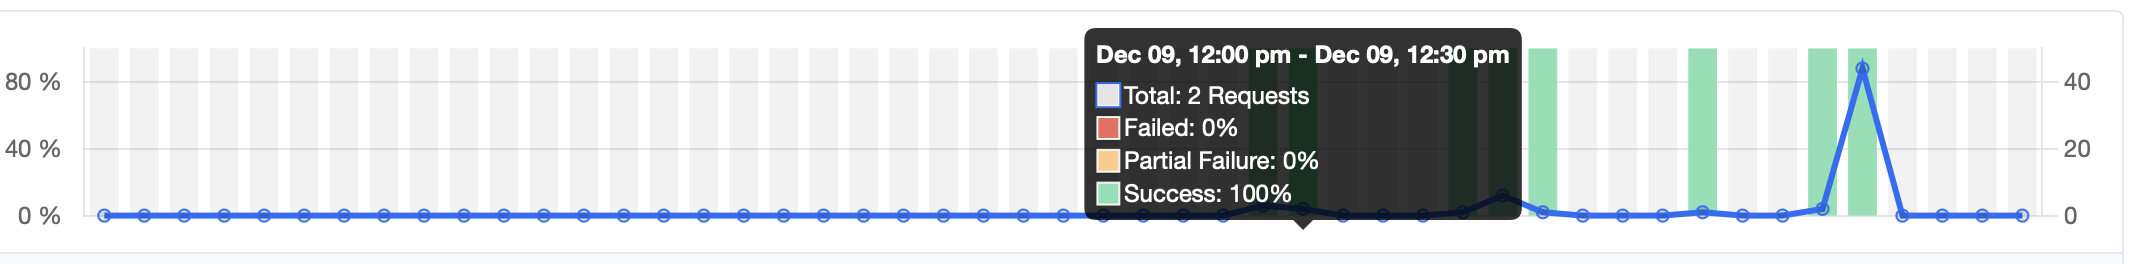
Interactive graph showing request volume with hover details
Log Retention
Logs default to “Last 1 day” when first opened. Choose from relative ranges (Last 1 day, 7 days, 30 days, and additional presets) or select absolute date ranges with timezone-aware selection. Older logs are retained for a period of time based on your pricing plan. For extended retention options, contact our sales team.Exporting Logs
Export logs and notification statuses to your own systems:Outbound Webhooks
Get instant alerts of notification statuses after delivery in a URL endpoint. Use for third-party logging, internal alerting, and real-time updates.
S3 Sync
Sync all logs: requests, workflow executions and messages to your own data warehouse for internal analytics or to power analytics and logs on your product.
Frequently Asked Questions
What does each message stage mean in SuprSend?
What does each message stage mean in SuprSend?
Each status represents a specific step in notification processing:
I don't see any error in message logs even though the notification was not delivered?
I don't see any error in message logs even though the notification was not delivered?
There can be 2 reasons for the delivery failure to not get logged:
- You have not configured the callback URL in your vendor dashboard. This is why SuprSend is not getting delivery status updates from the vendor.
- If you’ve configured the webhook and still not seeing delivery status, there’s a delay in delivery status by vendor.
Which message stages are tracked per channel?
Which message stages are tracked per channel?
Why don’t I see delivery, seen, or click events in logs?
Why don’t I see delivery, seen, or click events in logs?
Delivery and engagement events require vendor callbacks for SMS, Email and WhatsApp. For push channels, there’s a setup to enable delivery status tracking.Ensure the callback URL
https://hub.suprsend.com/webhook/* is set in your vendor dashboard or in case of push channels, see if the SDK setup is done correctly.Why are some notification logs delayed or out of order?
Why are some notification logs delayed or out of order?
Log events can appear delayed because delivery, seen, and click updates depend on asynchronous vendor callbacks and there’s a delay in webhook response from vendor.
What timezone are notification logs shown in?
What timezone are notification logs shown in?
Notification logs are displayed in the browser’s local timezone by default. You can change the timezone from the top navbar to your desired timezone. You can also set relative timestamp if needed.
Why was a notification channel skipped for a user?
Why was a notification channel skipped for a user?
A channel may be skipped due to user opt-outs, missing channel identifiers, or vendor and configuration constraints.These decisions are recorded in broadcast execution and message logs.
Are there limits on searching or accessing notification logs?
Are there limits on searching or accessing notification logs?
Logs have a retention period based on your pricing plan. Generally varies between 30 days to 90 days. Logs older than the retention period are not accessible.
Additional Resources
Error Guides
List of possible errors occurred and their resolutions.
Get Support
If you need help debugging a workflow, copy Execution ID and contact SuprSend support via in-product chat, email, or Slack community