Stream real time SuprSend notification metrics, API requests, and delivery events to your Datadog account via OpenTelemetry OTLP with sub minute latency.
The SuprSend Datadog connector streams notification metrics to your Datadog account via OpenTelemetry (OTLP) in near real-time - with latency under 1 minute. It covers three key areas of your notification pipeline:
API Requests
Track every API call hitting SuprSend - success/failure counts, error breakdowns, and request volume over time.
Workflow Executions
Monitor workflow performance, catch execution errors early, and identify top failing workflows.
Messages
Follow the full message lifecycle - triggered, delivered, seen, clicked - with delivery errors by vendor and channel.
Enterprise plan feature. The SuprSend Datadog connector is only available on our Enterprise plan.
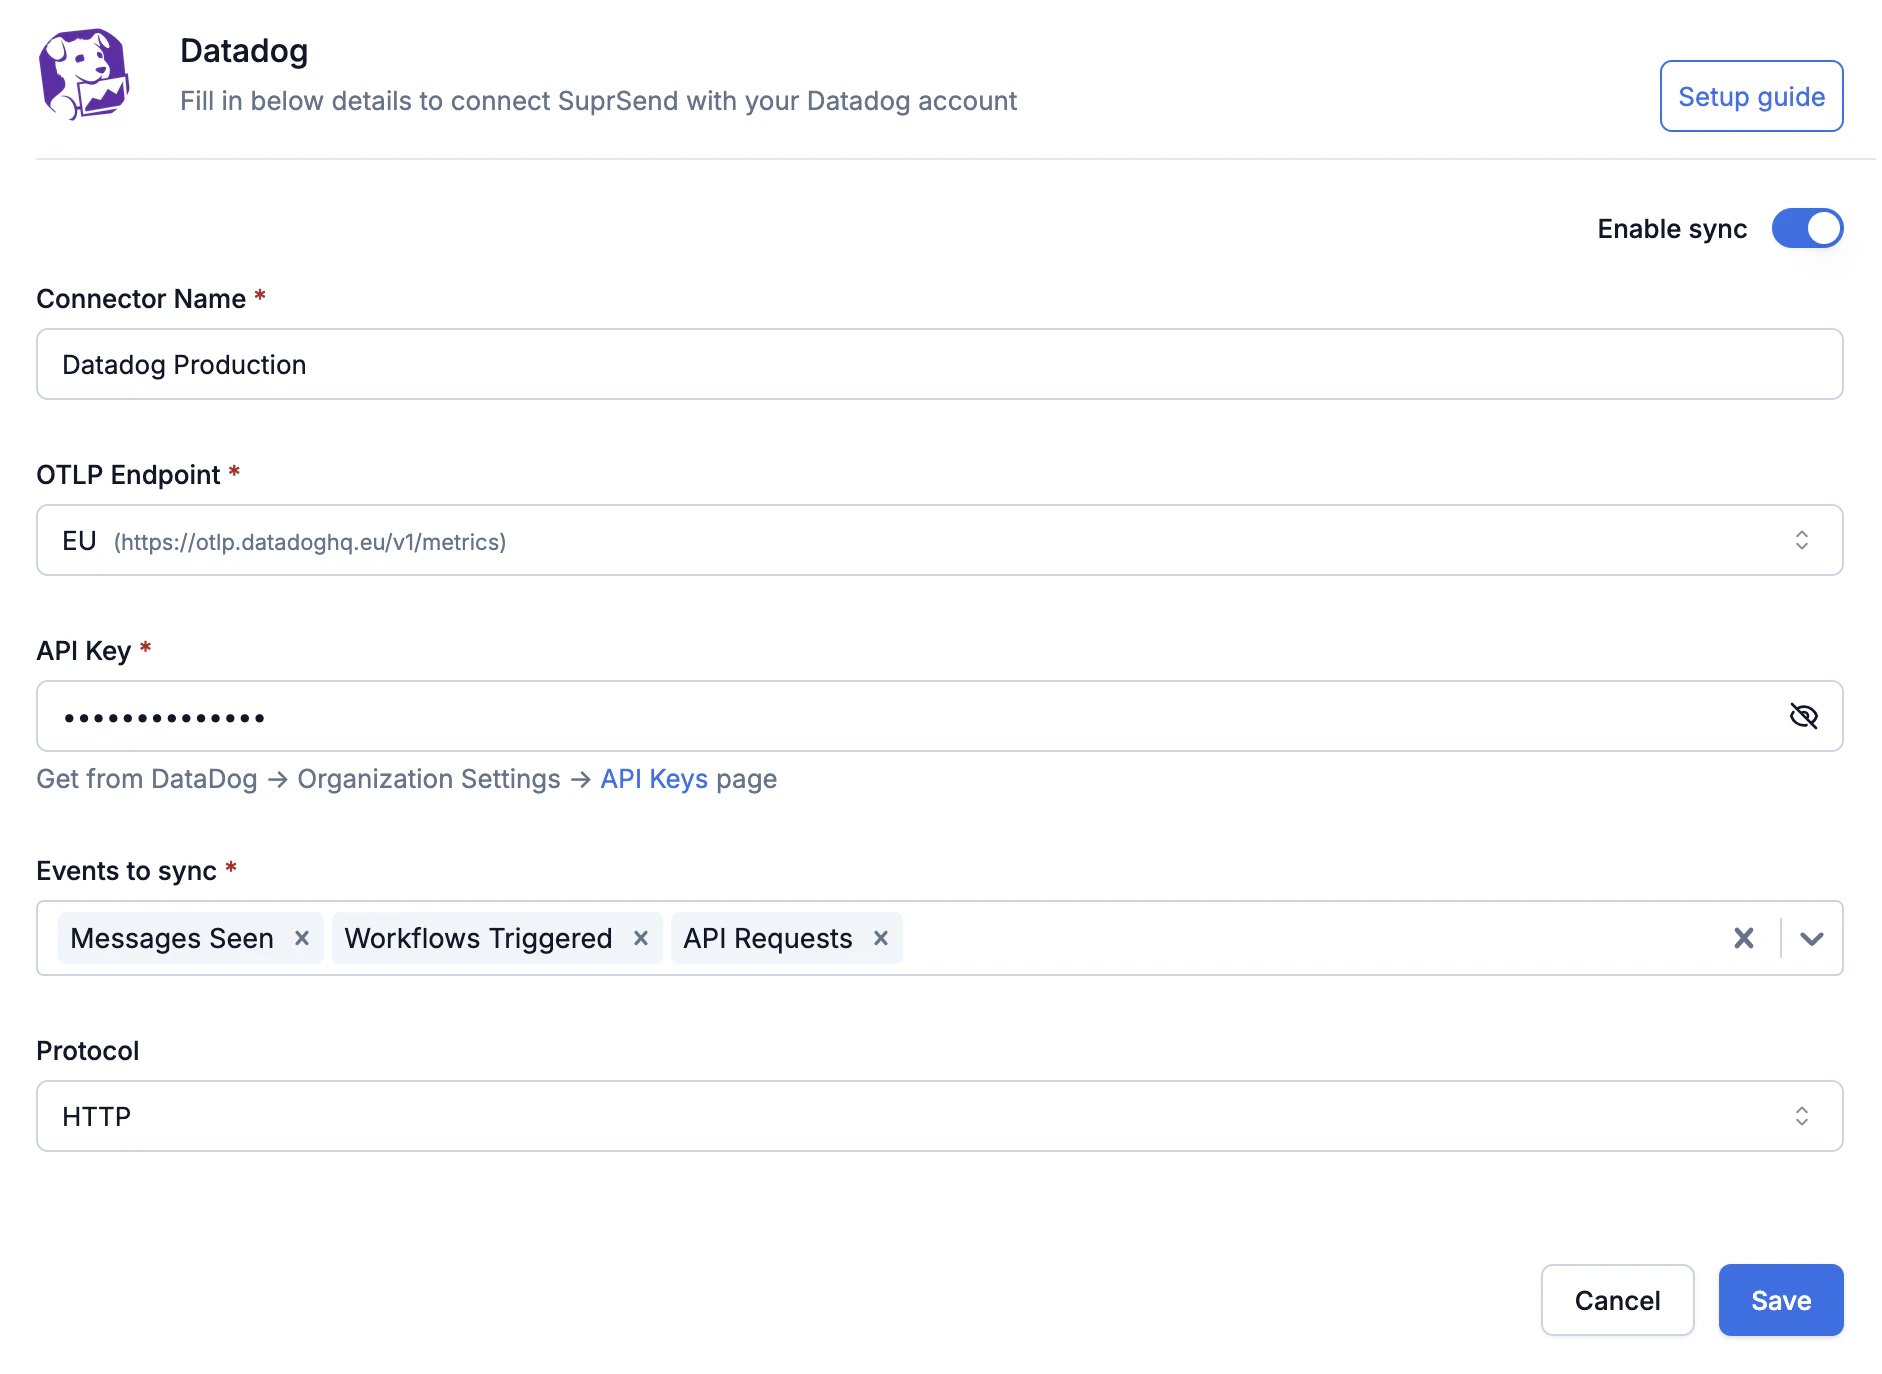
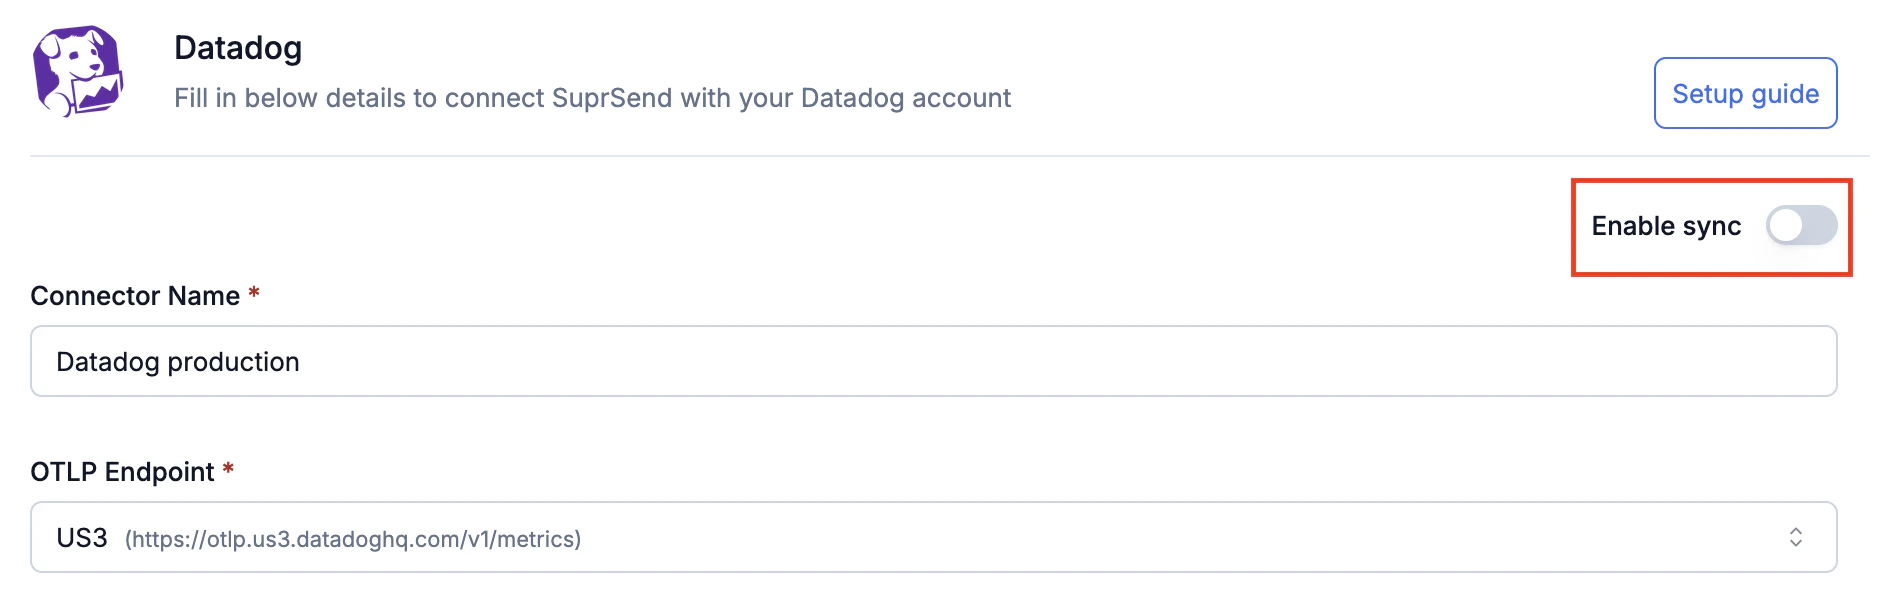
SuprSend exports suprsend.* metrics to Datadog via OTLP over HTTP. You provide your Datadog OTLP endpoint and API key, choose which events to sync, and SuprSend streams them in near real-time - with latency under 1 minute.Once connected you can build custom dashboards, set up monitors and alerts for delivery failures or API errors, slice by any dimension (workspace, tenant, workflow, channel, vendor, template), and correlate notification health with your infrastructure and APM data in Datadog.All metrics are tagged by workspace, tenant, workflow, category, channel, vendor, template, node, and error details. See Reported metrics for the full list.
Please refer to your Datadog pricing agreement for information on how custom metrics sent to Datadog are priced for your account.
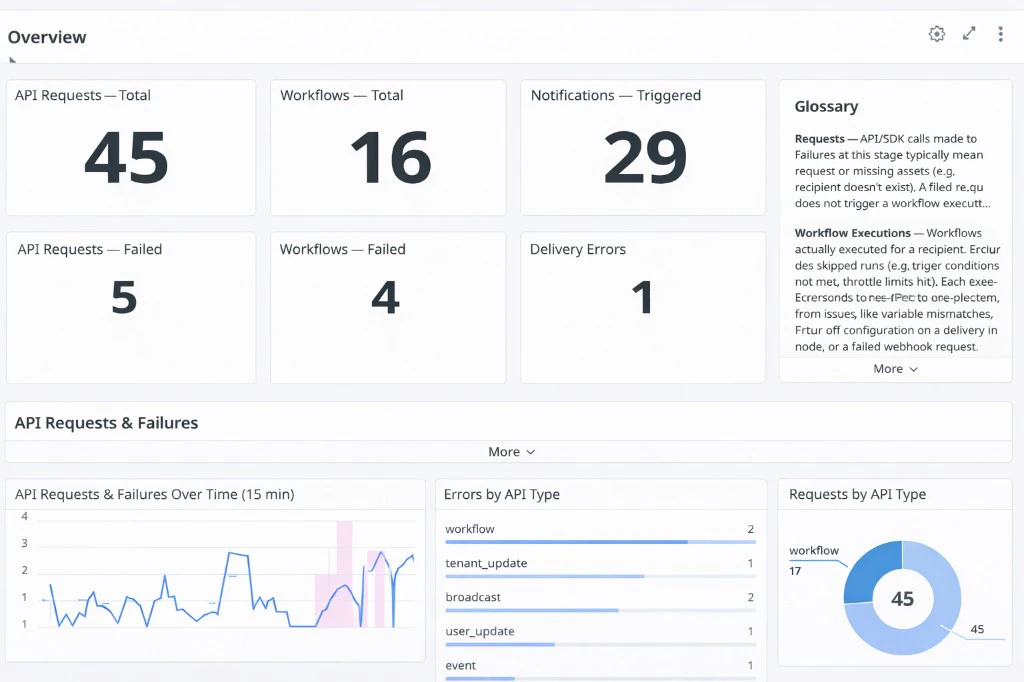
Get started quickly with our pre-built Datadog dashboard to visualize your SuprSend metrics in a few clicks.
SuprSend Notification Overview dashboard in Datadog
Copy Dashboard Starter Kit JSON
{"title":"SuprSend Notification Dashboard","description":"","layout_type":"ordered","reflow_type":"fixed","tags":[],"template_variables":[{"name":"api_type","prefix":"api_type","available_values":[],"default":"*"},{"name":"workflow_slug","prefix":"workflow_slug","available_values":[],"default":"*"},{"name":"category","prefix":"category","available_values":[],"default":"*"},{"name":"channel","prefix":"channel","available_values":[],"default":"*"},{"name":"vendor","prefix":"vendor","available_values":[],"default":"*"}],"widgets":[{"definition":{"type":"note","content":"## Overview","background_color":"white","font_size":"14","text_align":"left","vertical_align":"top","show_tick":false,"tick_pos":"50%","tick_edge":"left","has_padding":true},"layout":{"x":0,"y":0,"width":12,"height":1}},{"definition":{"type":"query_value","title":"API Requests \u2014 Total","title_size":"16","title_align":"left","requests":[{"formulas":[{"formula":"query1","alias":"Total Requests"}],"queries":[{"name":"query1","data_source":"metrics","query":"sum:suprsend.api_request.total{*}.as_count()","aggregator":"sum"}],"response_format":"scalar"}],"autoscale":true,"precision":0},"layout":{"x":0,"y":1,"width":3,"height":2}},{"definition":{"type":"query_value","title":"Workflows \u2014 Total","title_size":"16","title_align":"left","requests":[{"formulas":[{"formula":"query1","alias":"Total Executions"}],"queries":[{"name":"query1","data_source":"metrics","query":"sum:suprsend.workflow_execution.total{*}.as_count()","aggregator":"sum"}],"response_format":"scalar"}],"autoscale":true,"precision":0},"layout":{"x":3,"y":1,"width":3,"height":2}},{"definition":{"type":"query_value","title":"Notifications \u2014 Triggered","title_size":"16","title_align":"left","requests":[{"formulas":[{"formula":"query1","alias":"Triggered"}],"queries":[{"name":"query1","data_source":"metrics","query":"sum:suprsend.messages.triggered{*}.as_count()","aggregator":"sum"}],"response_format":"scalar"}],"autoscale":true,"precision":0},"layout":{"x":6,"y":1,"width":3,"height":2}},{"definition":{"type":"note","content":"### Glossary\n\n**Requests** \u2014 API/SDK calls made to SuprSend. Failures at this stage typically mean a bad request or missing assets (for example recipient not found, workflow doesn't exist). A failed request does not trigger a workflow execution.\n\n**Workflow Executions** \u2014 Workflows that were actually executed for a recipient. This excludes skipped runs (for example trigger conditions not met, throttle limits hit). Each execution corresponds to one recipient. Errors here stem from issues like variable mismatches, incorrect vendor configuration on a delivery node, or a failed webhook request.\n\n**Notifications** \u2014 Messages sent by SuprSend to the end vendor (for example SendGrid, Twilio, FCM). For out-of-the-box channels, final delivery is handled by the vendor, and delivery errors are reported back by them. The exception is Inbox, where SuprSend handles delivery end-to-end. Common causes of delivery failures include vendor misconfiguration, invalid or expired channel credentials (for example a stale push token), or client-side blocks (for example mailbox full, DND settings).","background_color":"white","font_size":"12","text_align":"left","vertical_align":"top","show_tick":false,"tick_pos":"50%","tick_edge":"left","has_padding":true},"layout":{"x":9,"y":1,"width":3,"height":4}},{"definition":{"type":"query_value","title":"API Requests \u2014 Failed","title_size":"16","title_align":"left","requests":[{"formulas":[{"formula":"query1","alias":"Failed"}],"queries":[{"name":"query1","data_source":"metrics","query":"sum:suprsend.api_request.errors{*}.as_count()","aggregator":"sum"}],"response_format":"scalar","conditional_formats":[{"comparator":">","value":0,"palette":"red_on_white"},{"comparator":"<=","value":0,"palette":"green_on_white"}]}],"autoscale":true,"precision":0},"layout":{"x":0,"y":3,"width":3,"height":2}},{"definition":{"type":"query_value","title":"Workflows \u2014 Failed","title_size":"16","title_align":"left","requests":[{"formulas":[{"formula":"query1 + query2","alias":"Failed"}],"queries":[{"name":"query1","data_source":"metrics","query":"sum:suprsend.workflow_execution.errors{*}.as_count()","aggregator":"sum"},{"name":"query2","data_source":"metrics","query":"sum:suprsend.broadcast_execution.errors{*}.as_count()","aggregator":"sum"}],"response_format":"scalar","conditional_formats":[{"comparator":">","value":0,"palette":"red_on_white"},{"comparator":"<=","value":0,"palette":"green_on_white"}]}],"autoscale":true,"precision":0},"layout":{"x":3,"y":3,"width":3,"height":2}},{"definition":{"type":"query_value","title":"Delivery Errors","title_size":"16","title_align":"left","requests":[{"formulas":[{"formula":"query1","alias":"Delivery Failures"}],"queries":[{"name":"query1","data_source":"metrics","query":"sum:suprsend.messages.delivery_errors{*}.as_count()","aggregator":"sum"}],"response_format":"scalar","conditional_formats":[{"comparator":">","value":0,"palette":"red_on_white"},{"comparator":"<=","value":0,"palette":"green_on_white"}]}],"autoscale":true,"precision":0},"layout":{"x":6,"y":3,"width":3,"height":2}},{"definition":{"type":"note","content":"## API Requests & Failures\n**Requests** \u2014 API calls made to SuprSend (workflow triggers, event tracking, user updates etc.). Use the template variables at the top to filter by `api_type`.","background_color":"white","font_size":"14","text_align":"left","vertical_align":"top","show_tick":false,"tick_pos":"50%","tick_edge":"left","has_padding":true},"layout":{"x":0,"y":5,"width":12,"height":1}},{"definition":{"type":"timeseries","title":"API Requests & Failures Over Time (15 min)","title_size":"16","title_align":"left","show_legend":true,"legend_layout":"auto","legend_columns":["avg","min","max","value","sum"],"requests":[{"formulas":[{"formula":"query1","alias":"Total Requests","style":{"palette":"blue","palette_index":4}},{"formula":"query2","alias":"Failed Requests","style":{"palette":"red","palette_index":4}}],"queries":[{"name":"query1","data_source":"metrics","query":"sum:suprsend.api_request.total{$api_type}.as_count().rollup(sum, 900)"},{"name":"query2","data_source":"metrics","query":"sum:suprsend.api_request.errors{$api_type}.as_count().rollup(sum, 900)"}],"response_format":"timeseries","display_type":"line","style":{"palette":"dog_classic","line_type":"solid","line_width":"normal"}}],"yaxis":{"include_zero":true}},"layout":{"x":0,"y":6,"width":5,"height":3}},{"definition":{"type":"toplist","title":"Errors by API Type","title_size":"16","title_align":"left","requests":[{"formulas":[{"formula":"query1","alias":"Error Count","limit":{"count":10,"order":"desc"}}],"queries":[{"name":"query1","data_source":"metrics","query":"sum:suprsend.api_request.errors{$api_type} by {api_type}.as_count()","aggregator":"sum"}],"response_format":"scalar"}]},"layout":{"x":5,"y":6,"width":4,"height":3}},{"definition":{"type":"sunburst","title":"Requests by API Type","title_size":"16","title_align":"left","requests":[{"formulas":[{"formula":"query1"}],"queries":[{"name":"query1","data_source":"metrics","query":"sum:suprsend.api_request.total{$api_type} by {api_type}.as_count()","aggregator":"sum"}],"response_format":"scalar"}]},"layout":{"x":9,"y":6,"width":3,"height":3}},{"definition":{"type":"note","content":"## Workflow Executions & Failures\n**Executions** \u2014 Workflow and broadcast runs that process notification logic (routing, templates, channel selection). Use the template variables to filter by `workflow_slug` or `category`.","background_color":"white","font_size":"14","text_align":"left","vertical_align":"top","show_tick":false,"tick_pos":"50%","tick_edge":"left","has_padding":true},"layout":{"x":0,"y":9,"width":12,"height":1}},{"definition":{"type":"timeseries","title":"Workflow Executions & Errors Over Time (15 min)","title_size":"16","title_align":"left","show_legend":true,"legend_layout":"auto","legend_columns":["avg","min","max","value","sum"],"requests":[{"formulas":[{"formula":"query1","alias":"Total Executions"},{"formula":"query2","alias":"Workflow Errors","style":{"palette":"red","palette_index":4}},{"formula":"query3","alias":"Broadcast Errors","style":{"palette":"red","palette_index":2}}],"queries":[{"name":"query1","data_source":"metrics","query":"sum:suprsend.workflow_execution.total{$workflow_slug,$category}.as_count().rollup(sum, 900)"},{"name":"query2","data_source":"metrics","query":"sum:suprsend.workflow_execution.errors{$workflow_slug,$category}.as_count().rollup(sum, 900)"},{"name":"query3","data_source":"metrics","query":"sum:suprsend.broadcast_execution.errors{$workflow_slug,$category}.as_count().rollup(sum, 900)"}],"response_format":"timeseries","display_type":"line","style":{"palette":"dog_classic","line_type":"solid","line_width":"normal"}}],"yaxis":{"include_zero":true}},"layout":{"x":0,"y":10,"width":5,"height":3}},{"definition":{"type":"toplist","title":"Top Failing Workflows","title_size":"16","title_align":"left","requests":[{"formulas":[{"formula":"query1","alias":"Errors","limit":{"count":100,"order":"desc"}}],"queries":[{"name":"query1","data_source":"metrics","query":"sum:suprsend.workflow_execution.errors{$workflow_slug,$category} by {workflow_slug}.as_count()","aggregator":"sum"}],"response_format":"scalar"}]},"layout":{"x":5,"y":10,"width":4,"height":3}},{"definition":{"type":"sunburst","title":"Executions by Workflow","title_size":"16","title_align":"left","requests":[{"formulas":[{"formula":"query1"}],"queries":[{"name":"query1","data_source":"metrics","query":"sum:suprsend.workflow_execution.total{$workflow_slug,$category} by {workflow_slug}.as_count()","aggregator":"sum"}],"response_format":"scalar"}]},"layout":{"x":9,"y":10,"width":3,"height":3}},{"definition":{"type":"note","content":"## Notification Delivery & Engagement\n**Delivery** \u2014 Actual notifications sent to end-users via channels (email, SMS, push, WhatsApp, etc.). Use the template variables to filter by `channel` or `vendor`.","background_color":"white","font_size":"14","text_align":"left","vertical_align":"top","show_tick":false,"tick_pos":"50%","tick_edge":"left","has_padding":true},"layout":{"x":0,"y":13,"width":12,"height":1}},{"definition":{"type":"query_value","title":"Triggered","title_size":"16","title_align":"left","requests":[{"formulas":[{"formula":"query1","alias":"Triggered"}],"queries":[{"name":"query1","data_source":"metrics","query":"sum:suprsend.messages.triggered{$channel,$vendor}.as_count()","aggregator":"sum"}],"response_format":"scalar"}],"autoscale":true,"precision":0},"layout":{"x":0,"y":14,"width":2,"height":2}},{"definition":{"type":"query_value","title":"Delivered","title_size":"16","title_align":"left","requests":[{"formulas":[{"formula":"query1","alias":"Delivered"}],"queries":[{"name":"query1","data_source":"metrics","query":"sum:suprsend.messages.delivered{$channel,$vendor}.as_count()","aggregator":"sum"}],"response_format":"scalar"}],"autoscale":true,"precision":0},"layout":{"x":2,"y":14,"width":2,"height":2}},{"definition":{"type":"query_value","title":"Delivery Failures","title_size":"16","title_align":"left","requests":[{"formulas":[{"formula":"query1","alias":"Delivery Failures"}],"queries":[{"name":"query1","data_source":"metrics","query":"sum:suprsend.messages.delivery_errors{$channel,$vendor}.as_count()","aggregator":"sum"}],"response_format":"scalar","conditional_formats":[{"comparator":">","value":0,"palette":"red_on_white"},{"comparator":"<=","value":0,"palette":"green_on_white"}]}],"autoscale":true,"precision":0},"layout":{"x":4,"y":14,"width":2,"height":2}},{"definition":{"type":"query_value","title":"Seen","title_size":"16","title_align":"left","requests":[{"formulas":[{"formula":"query1","alias":"Seen"}],"queries":[{"name":"query1","data_source":"metrics","query":"sum:suprsend.messages.seen{$channel,$vendor}.as_count()","aggregator":"sum"}],"response_format":"scalar"}],"autoscale":true,"precision":0},"layout":{"x":6,"y":14,"width":2,"height":2}},{"definition":{"type":"query_value","title":"Clicked","title_size":"16","title_align":"left","requests":[{"formulas":[{"formula":"query1","alias":"Clicked"}],"queries":[{"name":"query1","data_source":"metrics","query":"sum:suprsend.messages.clicked{$channel,$vendor}.as_count()","aggregator":"sum"}],"response_format":"scalar"}],"autoscale":true,"precision":0},"layout":{"x":8,"y":14,"width":2,"height":2}},{"definition":{"type":"query_value","title":"% Delivered","title_size":"16","title_align":"left","requests":[{"formulas":[{"formula":"(query2 / query1) * 100","alias":"% Delivered"}],"queries":[{"name":"query1","data_source":"metrics","query":"sum:suprsend.messages.triggered{$channel,$vendor}.as_count()","aggregator":"sum"},{"name":"query2","data_source":"metrics","query":"sum:suprsend.messages.delivered{$channel,$vendor}.as_count()","aggregator":"sum"}],"response_format":"scalar"}],"autoscale":false,"precision":1,"custom_unit":"%"},"layout":{"x":10,"y":14,"width":2,"height":2}},{"definition":{"type":"timeseries","title":"Delivered & Delivery Errors Over Time (15 min)","title_size":"16","title_align":"left","show_legend":true,"legend_layout":"auto","legend_columns":["avg","min","max","value","sum"],"requests":[{"formulas":[{"formula":"query1","alias":"Triggered"},{"formula":"query2","alias":"Delivered"},{"formula":"query3","alias":"Delivery Errors","style":{"palette":"red","palette_index":4}}],"queries":[{"name":"query1","data_source":"metrics","query":"sum:suprsend.messages.triggered{$channel,$vendor}.as_count().rollup(sum, 900)"},{"name":"query2","data_source":"metrics","query":"sum:suprsend.messages.delivered{$channel,$vendor}.as_count().rollup(sum, 900)"},{"name":"query3","data_source":"metrics","query":"sum:suprsend.messages.delivery_errors{$channel,$vendor}.as_count().rollup(sum, 900)"}],"response_format":"timeseries","display_type":"line","style":{"palette":"dog_classic","line_type":"solid","line_width":"normal"}}],"yaxis":{"include_zero":true}},"layout":{"x":0,"y":16,"width":6,"height":3}},{"definition":{"type":"timeseries","title":"Seen & Clicked Over Time (15 min)","title_size":"16","title_align":"left","show_legend":true,"legend_layout":"auto","legend_columns":["avg","min","max","value","sum"],"requests":[{"formulas":[{"formula":"query1","alias":"Seen"},{"formula":"query2","alias":"Clicked"}],"queries":[{"name":"query1","data_source":"metrics","query":"sum:suprsend.messages.seen{$channel,$vendor}.as_count().rollup(sum, 900)"},{"name":"query2","data_source":"metrics","query":"sum:suprsend.messages.clicked{$channel,$vendor}.as_count().rollup(sum, 900)"}],"response_format":"timeseries","display_type":"line","style":{"palette":"dog_classic","line_type":"solid","line_width":"normal"}}],"yaxis":{"include_zero":true}},"layout":{"x":6,"y":16,"width":6,"height":3}},{"definition":{"type":"query_table","title":"Delivery & Engagement \u2014 Workflow Level Breakdown","title_size":"16","title_align":"left","requests":[{"formulas":[{"formula":"query1","alias":"Triggered","cell_display_mode":"number"},{"formula":"(query2 / query1) * 100","alias":"% Delivered","cell_display_mode":"number"},{"formula":"(query3 / query2) * 100","alias":"% Seen / Delivered","cell_display_mode":"number"},{"formula":"(query4 / query2) * 100","alias":"% Clicked / Delivered","cell_display_mode":"number"}],"queries":[{"name":"query1","data_source":"metrics","query":"sum:suprsend.messages.triggered{$workflow_slug,$category,$channel,$vendor} by {workflow_slug,category,channel,vendor}.as_count()","aggregator":"sum"},{"name":"query2","data_source":"metrics","query":"sum:suprsend.messages.delivered{$workflow_slug,$category,$channel,$vendor} by {workflow_slug,category,channel,vendor}.as_count()","aggregator":"sum"},{"name":"query3","data_source":"metrics","query":"sum:suprsend.messages.seen{$workflow_slug,$category,$channel,$vendor} by {workflow_slug,category,channel,vendor}.as_count()","aggregator":"sum"},{"name":"query4","data_source":"metrics","query":"sum:suprsend.messages.clicked{$workflow_slug,$category,$channel,$vendor} by {workflow_slug,category,channel,vendor}.as_count()","aggregator":"sum"}],"response_format":"scalar","sort":{"count":100,"order_by":[{"type":"formula","index":0,"order":"desc"}]}}]},"layout":{"x":0,"y":19,"width":12,"height":5}}]}
To import, visit dashboards, click New Dashboard, then click the gear icon in the top-right corner and choose Import dashboard JSON. Paste the JSON above. Use the copy button to copy the JSON.
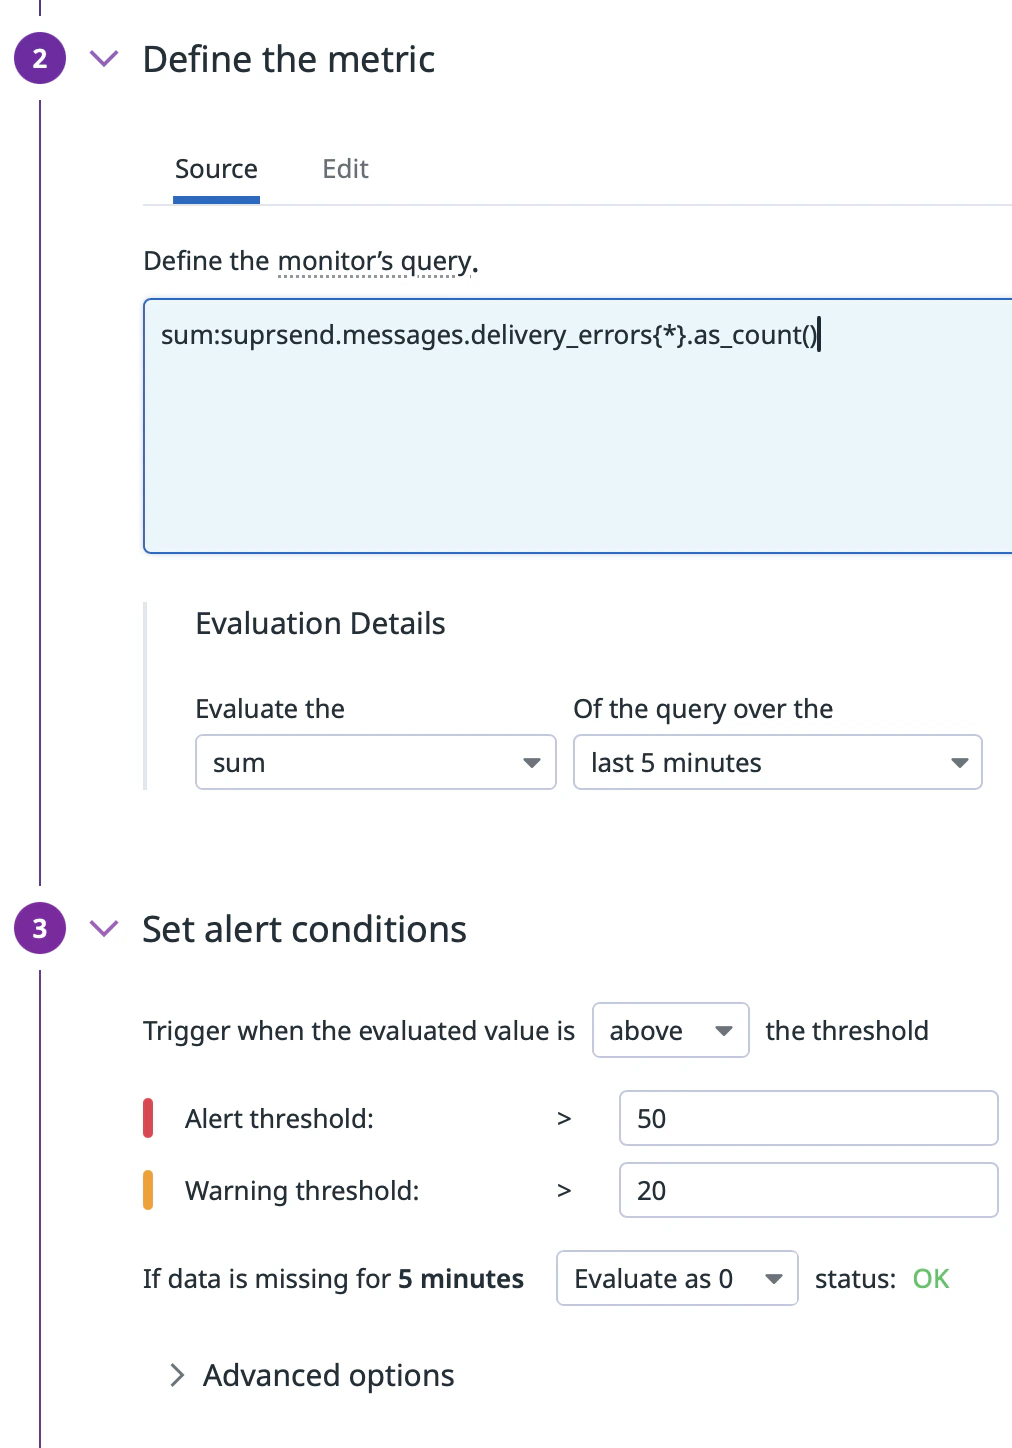
Once your metrics are flowing into Datadog, you can set up monitors to get paged when something goes wrong in your notification pipeline. Here are two examples to get you started.
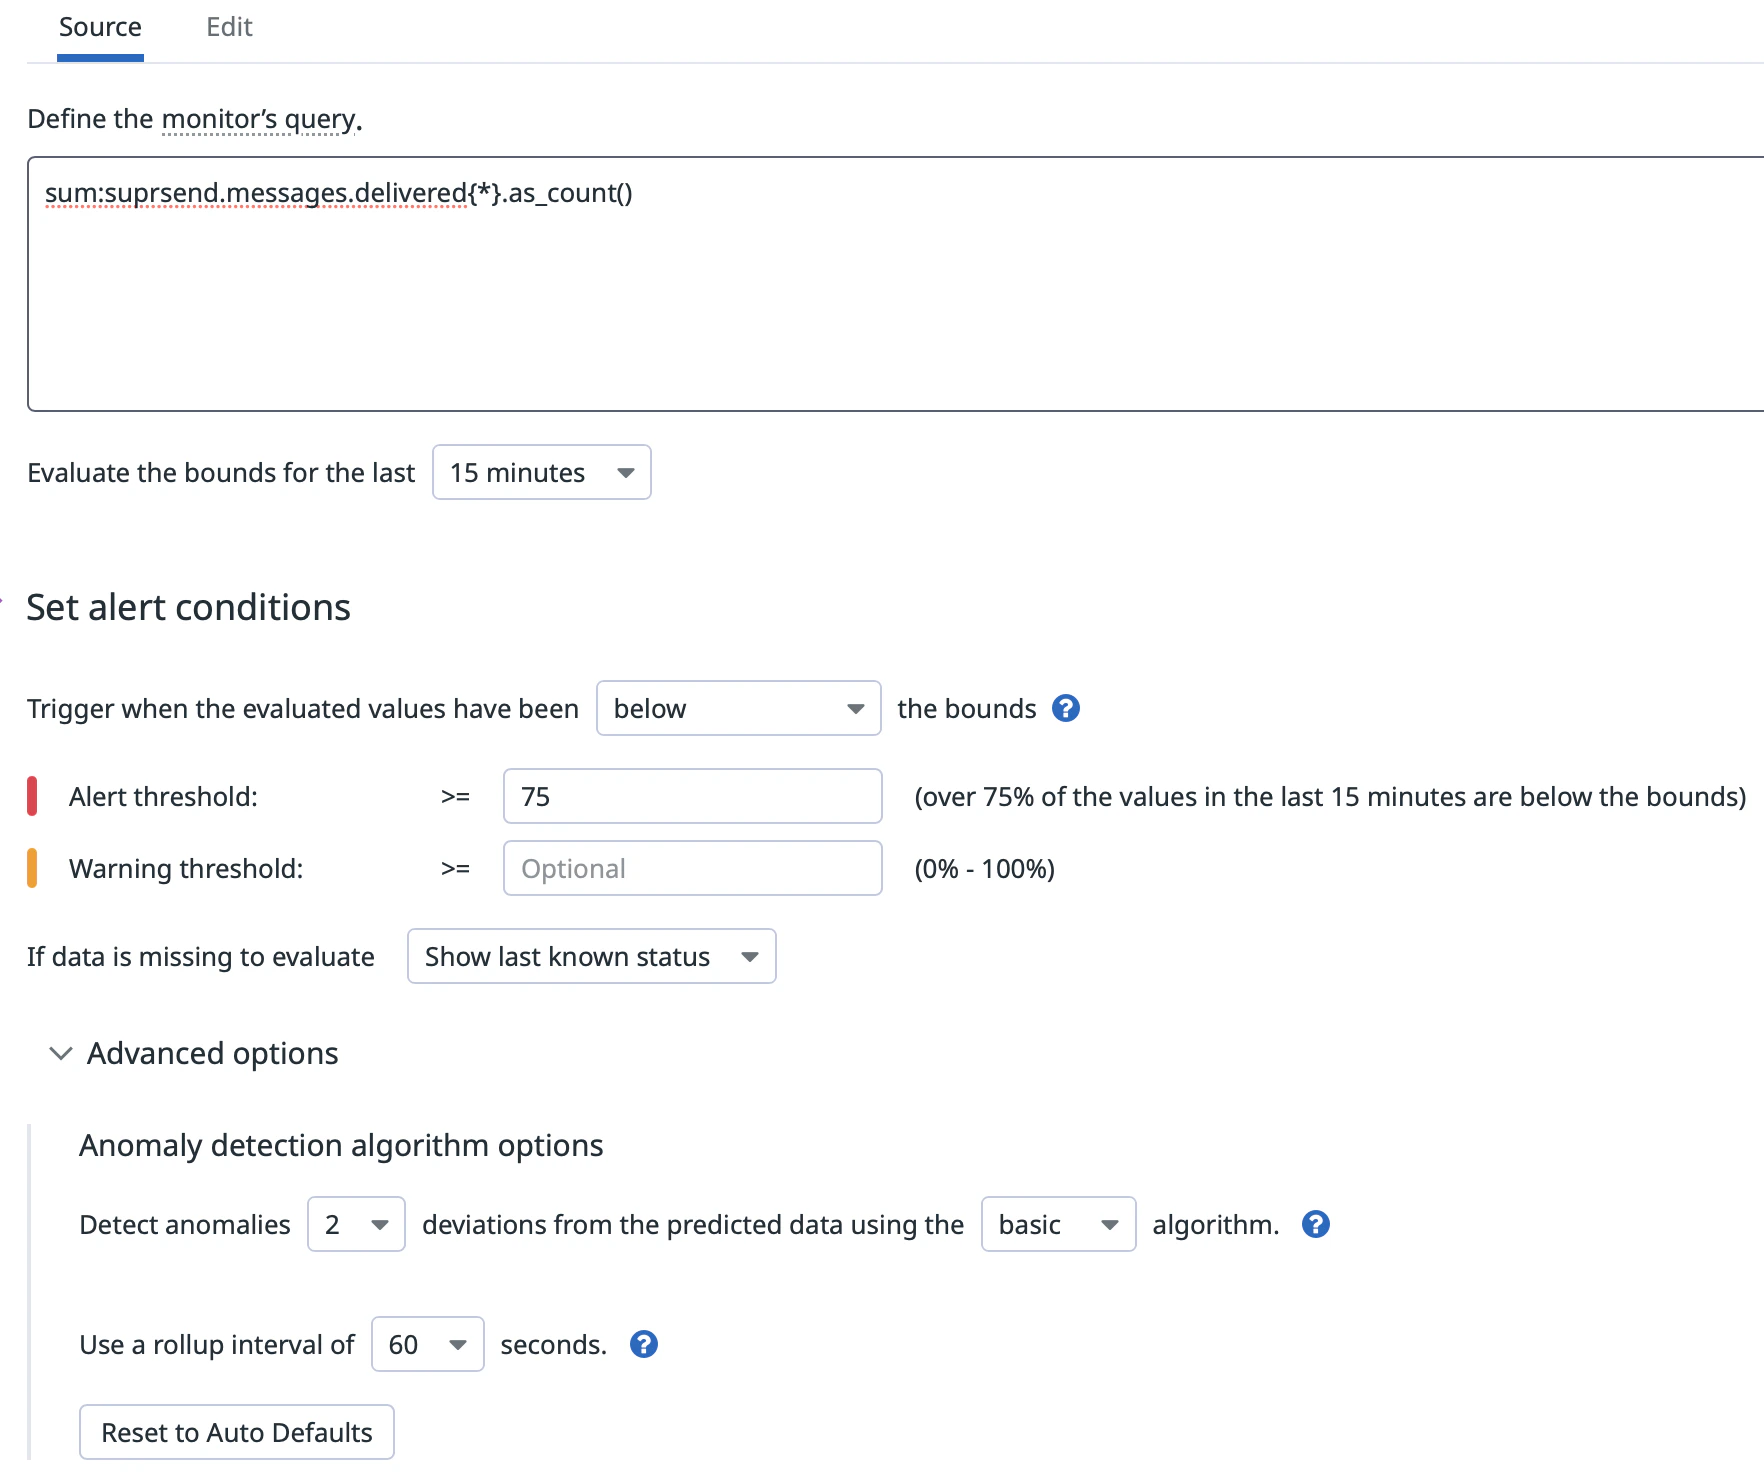
Example 2 - Alert on anomalous message delivery drop
Alert when delivered message volume drops unexpectedly - useful for catching silent failures where messages stop flowing without a corresponding error spike.
Message delivery has dropped below expected levels - {{value}} messages delivered in the last 15 minutes.Investigate: https://app.suprsend.com/logs
Add your notification recipients using @ mentions in the message body.
Click Save.
Scope either monitor to a specific workflow or channel by adding workflow_slug:your-workflow or channel:email to the metric query in step 3. This lets you create targeted monitors for your most critical notification flows.
SuprSend streams the following suprsend.* counter metrics to Datadog. All counters are monotonically increasing and represent cumulative counts from the time the connector is enabled.
Track the volume and health of every API call made to SuprSend.
Metric
Description
suprsend.api_request.total
Total number of API requests received by SuprSend. Use the status tag to break down by outcome - sent, in_progress, success, failed, or partial_failure.
suprsend.api_request.errors
API requests that failed to process due to an error. Group by api_type to identify which endpoint is failing, and by error_severity to prioritize investigation.
Monitor how your workflows and broadcasts are performing and quickly spot execution failures.
Metric
Description
suprsend.workflow_execution.total
Total number of workflow executions started. Workflow executions are counted per-recipient. Use workflow_slug and category tags to drill down into specific workflows.
suprsend.workflow_execution.errors
Workflow executions that failed to process due to an error.
suprsend.broadcast_execution.errors
Broadcast executions that failed to process due to an error.
Tags on Workflow Execution metrics
Tag
Description
Example values
workflow_slug
Slug of the workflow that was executed
welcome-flow, order-confirmation
trigger_type
How the workflow was triggered
api, event
category
Preference category of the workflow
transactional, promotional
root_category
Top-level category when categories are nested
marketing
ws_slug
Slug of the SuprSend workspace
my-workspace
ws_uid
Identifier of the SuprSend workspace (environment)
your_ws_uid
tenant_id
Tenant ID if the workflow is scoped to a tenant
tenant_abc
error_severity
Severity level of the error (on error metrics only)
All metrics are scoped to the SuprSend environment (for example production, staging) via the ws_uid tag.
For delivery, seen, and click metrics to be populated for Email, SMS, and WhatsApp, configure https://hub.suprsend.com/webhook/* as a callback URL in your vendor dashboard. See the vendor integration docs for per-vendor instructions.