The SuprSend OTel connector streams notification metrics via the OpenTelemetry Protocol (OTLP) over HTTP in near real-time — with latency under 1 minute. It covers three key areas of your notification pipeline:

API Requests

Track every API call hitting SuprSend — success/failure counts, error breakdowns, and request volume over time.

Workflow Executions

Monitor workflow performance, catch execution errors early, and identify top failing workflows.

Messages

Follow the full message lifecycle — triggered, delivered, seen, clicked — with delivery errors by vendor and channel.
Use it to connect SuprSend to any platform that accepts OTLP, including Grafana Cloud, Prometheus, Honeycomb, Dynatrace, or your own self-hosted OTel Collector.
Connecting to Datadog or New Relic? Use our dedicated connectors with pre-built dashboard starter kits — Datadog connector · New Relic connector
Enterprise plan feature. The SuprSend OTel connector is only available on our Enterprise plan.

How it works

SuprSend exports suprsend.* metrics via OTLP over HTTP. You provide your OTLP endpoint and authentication headers, choose which events to sync, and SuprSend streams them in near real-time — with latency under 1 minute. Once connected you can build custom dashboards, set up alerts for delivery failures or API errors, slice by any dimension (workspace, tenant, workflow, channel, vendor, template), and correlate notification health with your infrastructure and APM data. All metrics are tagged by workspace, tenant, workflow, category, channel, vendor, template, node, and error details. See Reported metrics for the full list.
Please refer to your observability platform’s pricing agreement for information on how custom metrics ingested via OTLP are priced.

Installing the connector

1

Create a new connector

In your SuprSend dashboard, navigate to Connectors and click New Connector.
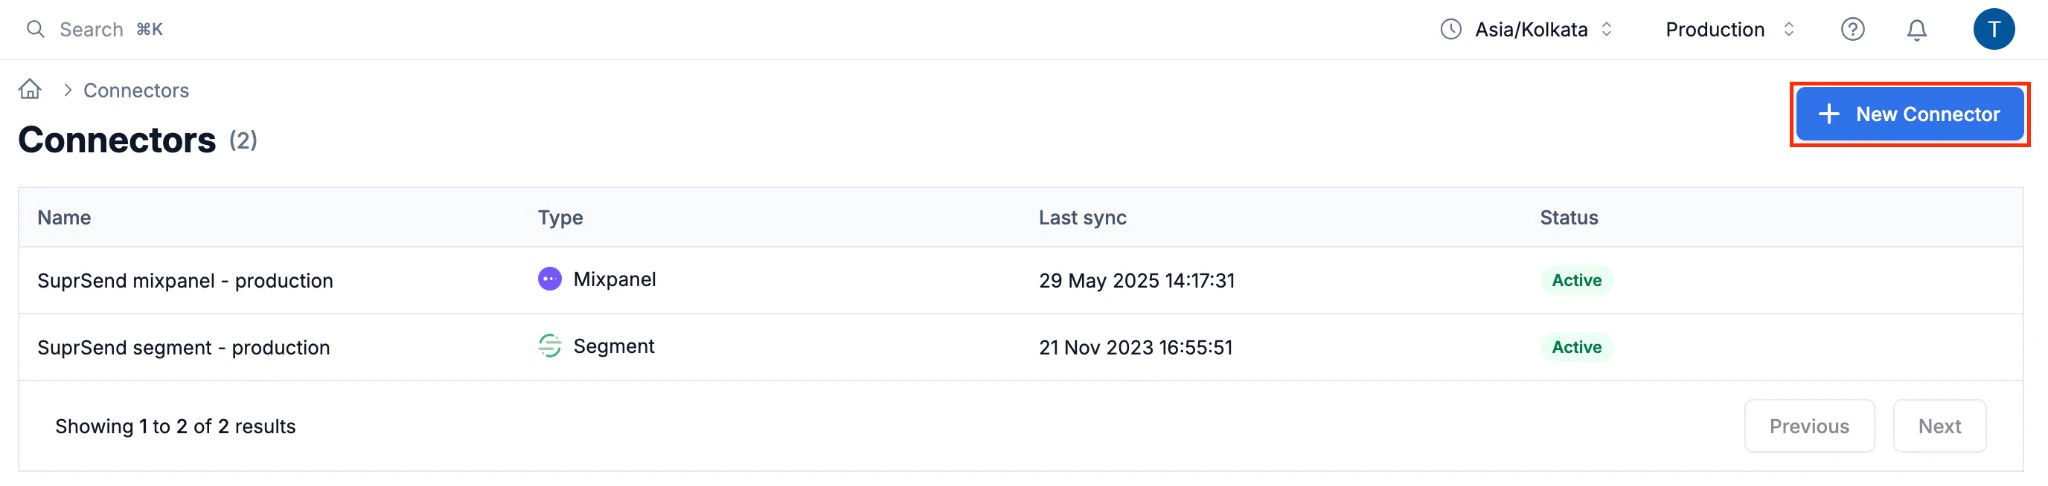
2

Configure connector settings

Fill in the following fields:
FieldDescription
Connector NameA label to identify this connector (e.g. Grafana Cloud Production)
Tool UsedThe name of the observability tool you are connecting to (e.g. Grafana Cloud)
OTLP EndpointYour platform’s OTLP HTTP endpoint URL (e.g. https://otlp-gateway-prod-us-east-0.grafana.net/otlp/v1/metrics)
HeadersOne or more HTTP headers for authentication. Click + Add Header to add key/value pairs (see Authentication below)
Events to syncOne or more metric events to export (see Reported metrics)
ProtocolHTTP
3

Save the connector

Click Save. Your metrics will start streaming to your platform within a few minutes.

Authentication

SuprSend passes authentication credentials as HTTP headers. The header format depends on your platform:
Auth typeHeader keyHeader valueUsed by
Bearer tokenAuthorizationBearer <your-api-key>Datadog, Honeycomb, Dynatrace
Basic authAuthorizationBasic <base64(username:password)>Grafana Cloud
Custom headervariesvariesSelf-hosted collectors
We recommend creating a dedicated API key or token specifically for SuprSend so you can rotate or revoke it independently without affecting other integrations.

Reported metrics

SuprSend streams the following suprsend.* counter metrics. All counters are monotonically increasing and represent cumulative counts from the time the connector is enabled.

API Requests

Track the volume and health of every API call made to SuprSend.
MetricDescription
suprsend.api_request.totalTotal number of API requests received by SuprSend. Use the status tag to break down by outcome — sent, in_progress, success, failed, or partial_failure.
suprsend.api_request.errorsAPI requests that failed to process due to an error. Group by api_type to identify which endpoint is failing, and by error_severity to prioritize investigation.
Tags on API Request metrics
TagDescriptionExample values
api_typeThe SuprSend API endpoint that was calledworkflow_trigger, broadcast_trigger, user_edit, event
methodHTTP method of the requestPOST, GET, PUT, PATCH
statusOutcome of the requestsent, in_progress, success, failed, partial_failure
workspace_keyIdentifier of the SuprSend workspace (environment)your_workspace_key
workspace_slugSlug of the SuprSend workspace. Eg. staging
tenant_idTenant ID if the request is scoped to a tenanttenant_abc
error_severitySeverity level of the error (on error metrics only)critical, warning, info

Workflow Executions

Monitor how your workflows and broadcasts are performing and quickly spot execution failures.
MetricDescription
suprsend.workflow_execution.totalTotal number of workflow executions started. Workflow executions are counted per-recipient. Use workflow_slug and category tags to drill down into specific workflows.
suprsend.workflow_execution.errorsWorkflow executions that failed to process due to an error.
suprsend.broadcast_execution.errorsBroadcast executions that failed to process due to an error.
Tags on Workflow Execution metrics
TagDescriptionExample values
workflow_slugSlug of the workflow that was executedwelcome-flow, order-confirmation
categoryNotification category of the workflowtransactional, promotional
workspace_slugSlug of the SuprSend workspacemy-workspace
workspace_keyIdentifier of the SuprSend workspace (environment)your_workspace_key
tenant_idTenant ID if the workflow is scoped to a tenanttenant_abc
error_severitySeverity level of the error (on error metrics only)critical, warning, info

Messages

Follow the full lifecycle of every message — from trigger through delivery, open, and click — and monitor delivery failures by vendor and channel.
MetricDescription
suprsend.messages.triggeredTotal number of messages triggered. Slice by channel and vendor to see volume distribution.
suprsend.messages.deliveredTotal number of messages delivered to the recipient.
suprsend.messages.delivery_errorsMessages that failed to deliver due to an error. Use vendor / channel tags to isolate the error source.
suprsend.messages.seenTotal number of messages seen by the recipient. Requires vendor webhook callbacks to be configured (see note below).
suprsend.messages.clickedTotal number of messages clicked by the recipient. Requires vendor webhook callbacks to be configured (see note below).
Tags on Message metrics
TagDescriptionExample values
workspace_slugSlug of the SuprSend workspacemy-workspace
workspace_keyIdentifier of the SuprSend workspace (environment)your_workspace_key
tenant_idTenant ID if the message is scoped to a tenanttenant_abc
categoryNotification category of the parent workflowtransactional, promotional
channelDelivery channel used for the messageemail, sms, push, whatsapp, inbox, slack, ms_teams
vendorVendor used to deliver the messagemailgun, twilio, firebase, sendgrid, etc.
workflow_slugSlug of the workflow that generated the messagewelcome-flow, order-confirmation
  • All metrics are scoped to the SuprSend environment (e.g. production, staging) via the workspace_key tag.
  • For delivery, seen, and click metrics to be populated for Email, SMS, and WhatsApp, configure https://hub.suprsend.com/webhook/* as a callback URL in your vendor dashboard. See the vendor integration docs for per-vendor instructions.
  • For error details, the SuprSend dashboard provides more granular information via Logs and Analytics.

Disabling the connector

To pause metrics streaming, open the connector from the Connectors page and toggle Enable sync off. Re-enable it at any time to resume.
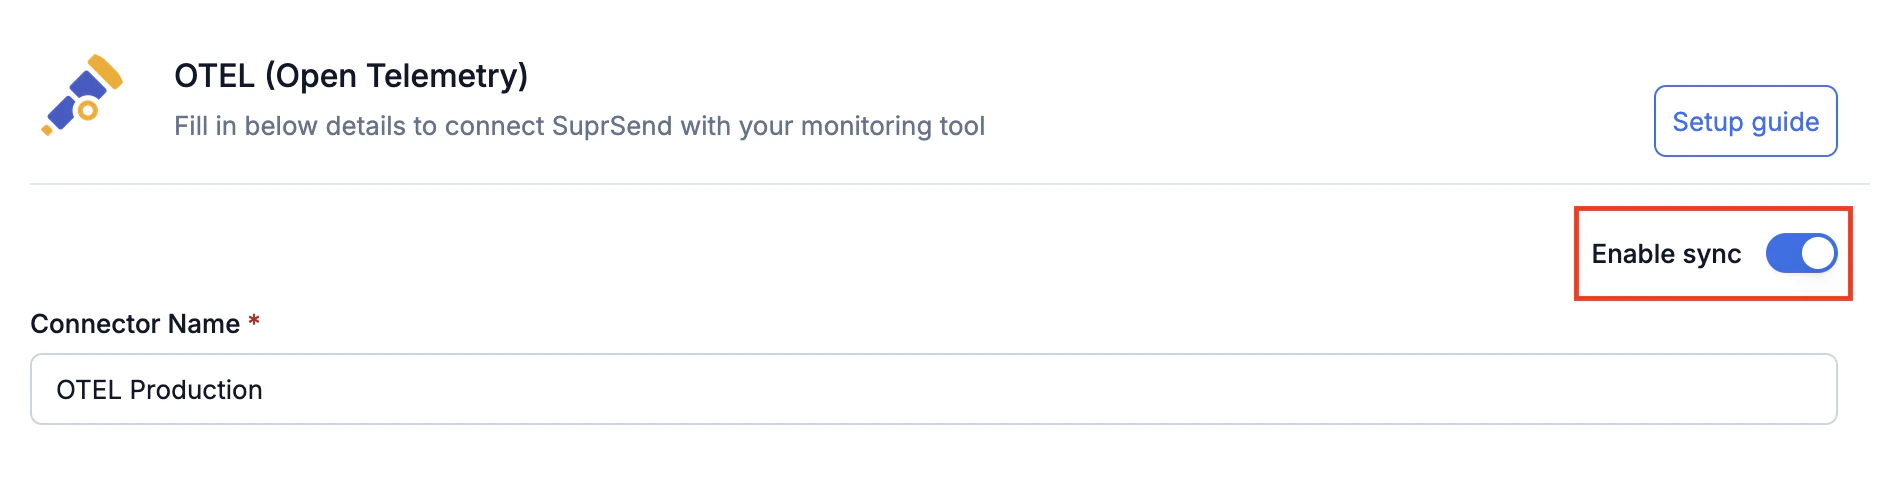